INTRODUCTION
One of the largest disruptions precipitated by the onset of the COVID-19 pandemic in early 2020—at least for those whose jobs allowed it—was the near instantaneous shift to working from home. Remote work,[1] which some saw as a temporary measure to get through the pandemic, has now become a subject of debate, as the working world looks to determine a new “normal”. Will people gradually make their way back into physical offices? Will remote work become the norm for certain types of workers? Or will a hybrid system emerge as default? Speculation abounds. Nevertheless, the picture of the post-COVID-19 working world remains murky. In this paper, we add to the evolving understanding of working from home both during the pandemic and afterwards, as companies, institutions, and individuals make decisions about the future of work.
Specifically, we address the following questions:
-
How prevalent is working from home during the pandemic?
-
Who increased working from home during the pandemic?
-
What factors contributed to increasing working from home during the pandemic?
-
Do people anticipate working from home after COVID-19 is no longer a threat?
-
Are there specific conditions associated with anticipated working from home in the future?
We examine these questions using the results of two representative on-line Qualtrics panel surveys conducted in the State of New Jersey in the winters of 2020-2021 and 2021-2022. We find evidence that respondents who could do so took advantage of working from home during the pandemic and that many of them are eager to continue working from home after the threat of COVID-19 subsides. We also find that there are associations with the level of education and most obviously, the ability to conduct work at home. These findings lead us to conclude that much of the shift to working from home is desired by employees but that these changes are dependent on employers allowing flexibility for their employees to work at home more frequently.
Background
The potential impacts of telecommuting on travel behavior have long been of interest to transportation scholars and planners. Research from as early as the 1970s suggested that increased working at home, facilitated by telecommunications technology, could drastically reduce commuting by bringing information processing (i.e., white collar) jobs to workers, rather than workers to those jobs (Harkness, 1977) .
The rapid maturation of information and communication technology (ICT) by the early 1990s was accompanied by an explosion of interest in telecommuting. Handy and Mokhtarian (1995) noted that a search in a popular research database for mentions of telecommuting yielded 94 results in 1985 and was on pace to surpass 2,300 mentions by 1994. Given this interest, they provided early estimates of two key telecommuting metrics: a) the penetration of telecommuting, defined as “the percentage of workers who telecommute, without regard for the frequency with which they do so”, and levels of telecommuting, defined as “the number of telecommuting occasions” (Handy & Mokhtarian, 1995). Combining Census data, private surveys, and a survey conducted by Caltrans, they estimated that by the mid-1990s, between two and three percent of U.S. workers telecommuted at least some of the time (around one percent of potential work occasions), and that 0.78 percent of workers primarily telecommuted.
As Handy and Mokhtarian (1996) pointed out, two main factors contribute to the potential expansion of telecommuting: a) whether employers provide the opportunity for telecommuting (i.e., supply-side issues), and b) whether workers take advantage of this opportunity (i.e., demand-side issues). Writing in the mid-1990s, they concluded that between changes in the supply-side (i.e., advances in technology, an increasingly globalized economy, and shifts in corporate culture) and changes in the demand-side (i.e., sociodemographic trends, increasing time pressures/traffic congestion, and stresses involved in commuting), an increase in telecommuting was on the horizon, if difficult to estimate with precision.
By the years leading up to the COVID-19 pandemic, working from home had expanded, but remained a comparatively niche practice. Shabanpour et al. (2018) estimated that slightly over 11% of workers in the Chicago area telecommuted at least some of the time, although only one percent did so almost every day, and only around five percent did so at least once a week, using the Chicago Metropolitan Agency for Planning’s Travel Tracker Survey conducted between 2007-2008. These estimates are lower than the 5.2 percent of workers who primarily work at home, according to the 2019 American Community Survey (ACS), but this difference is at least partially explained by the ACS including home-based jobs and businesses in this category as well as telecommuting (American Community Survey 5-year estimates, 2019).
Furthermore, incidences of working from home were not evenly distributed through the working population. In the sample obtained by Shabanpour et al. (2018), males, the middle-aged, those with higher educations and incomes, and those in communication and service industries all exhibited increased likelihood of working from home. There is a large pre-pandemic literature assessing the feasibility of working from home (generally referred to as telecommuting or telework), for example on productivity, work-life balance, sustainability, and feasibility (Chakrabarti, 2018; Lee, 2015; Sarbu, 2018). A recent review summarizes many of the costs and benefits associated with telecommuting, pre-COVID, including impacts on the workplace, productivity, and job satisfaction, among other measures; the literature has a mix of findings on whether impacts are beneficial or not (Allen et al., 2015). An earlier review examined prior work on the quality of working life; unsurprisingly they concluded that there are individual differences in how employees are affected with many not seeing an improvement in their quality of work life, though increased flexibility is beneficial for some (Shamir & Salomon, 1985). These impacts can affect how employees and employers view working at home and from our perspective, the desire and likelihood to do so in the future.
The onset of the COVID-19 pandemic in March 2020 led to large-scale working from home almost overnight. In a survey conducted in the Chicago area between April and June 2020, shortly after the onset of the pandemic, Shamshiripour et al. (2020) found that while 15% of their respondents worked from home five days a week or more before the pandemic, nearly half—48%—did so during the pandemic. Similarly, using a sample of highly educated, higher-income respondents in the United States, Conway et al. (2020) showed that while 40% of their respondents worked from home at least a few days per month before the pandemic, 78% did so after its onset.
Transit use was also affected by the pandemic. Government stay-at-home orders, implemented by most states in March 2020, shut down many activities and essentially forced non-essential workers to work from home, and transit use rapidly declined, even in New York City (Wang & Noland, 2021). Mouratidis and Peters (2022) fielded a population representative survey in Norway focused on Oslo and surrounding regions during the first wave of the pandemic. While their focus was on a variety of “teleactivities”, they also found (not surprisingly) an increase in telework during the time of their survey, but also examined how this varied by neighborhood density. They concluded that increases were larger in more densely populated areas, and speculated this may be due to a greater dependence on public transit in some densely populated neighborhoods. They do not analyze future desires to telecommute but speculate that it will continue to some extent (Mouratidis & Peters, 2022).
As with before the pandemic, not all workers have been equally able to shift to working from home. Those who worked in retail stores, emergency services, the transportation industry, and many other “essential” workers could not work from home (Shamshiripour et al., 2020). In general, the option to work from home is correlated with income: Those jobs that can be performed from home tend to be more highly paid compared with many “essential” jobs, insulating most higher-income workers from the negative economic effects brought on by the pandemic (Sanchez et al., 2021). However, the pandemic also revealed that some higher income jobs are also “essential”, for example in the medical professions, and while telehealth options were adopted, in-person contact was still needed for many procedures.
Before the pandemic, a major question concerning working from home was the extent to which this practice would expand in the future. In the emerging post-pandemic world, both employees and employers have experienced working at home and learned whether it is feasible. The question has now shifted to whether these changes will stick. This is important for understanding peak commute flows, the need for office space in central areas, and whether carbon emission reductions occur, among many other potential societal impacts.
Results from other research offer reason to believe that—to an extent—there will be some increase in working at home. The Pew Research Center surveyed U.S. workers in January 2022 and February 2023. They report that in January 2022, 43% of workers with a job that allowed them to work from home did so all the time and 35% were hybrid (17% most of the time and 18% some of the time). In February 2023, 35% of workers with a teleworkable job worked from home all of the time, with 41% hybrid (20% most of the time and 21% some of the time) (Parker, 2023). The surveys did not ask about their future expectations, although in both cases, over 75% of workers who could work from home did so at least some of the time. Using a survey sample weighted to represent U.S. adults, Salon et al. (2021) estimate that the proportion of workers who expect to work from home at least a few times per week is twice that before the pandemic, increasing from 13% to 26%. In a Dutch survey, de Haas et al. (2020) found that 27% of workers who started to work-from-home during the COVID-19 pandemic planned to continue working-from-home. Conway et al. (Conway et al., 2020), using a high-income, highly-educated sample, estimated 62% of their respondents would work from home at least a few days per month, compared to 40% before the pandemic. Similarly, Barrero et al. (2021), using the Survey of Working Arrangements and Attitudes, estimate that around 20% of full workdays will be at home after the pandemic. They also provide evidence that employers are planning to accommodate additional work-from-home arrangements as time goes on, given the extent to which the pandemic forced experimentation with telework that would not have otherwise been undertaken. Barbour et al. (2021) found that nearly 50 percent of the respondents who did not work-from-home before but started to work-from-home during the COVID-19 pandemic indicated a willingness to continue working from home. They also found based on a logit regression that gender, age, income, the presence of children, educational attainment, residential location, and job sector played a significant role in explaining behavioral shifts and post-pandemic preferences (Barbour et al., 2021). Kong et al. (2022) found that individuals holding a strong view against the pandemic were associated with never choosing to work-from-home during and after the pandemic (Kong et al., 2022). As of mid-2023, full days worked at home account for 28% of paid workdays among Americans 20-64 years old (Barrero et al., 2023).
Delventhal et al. (2022) analyzed the benefits of working-from-home and found that workers reported travel time savings and moving to more affordable neighborhoods (Delventhal et al., 2022). Similarly, we analyzed how people spent their time saved not commuting and found that people spent more time with family, watching TV, and sleeping later (Noland, Younes, et al., 2023b). Kossen & van der Berg (2022) found, on the other hand, using a German survey, that working-from-home leads to increased social isolation and less organizational identification (Kossen & van der Berg, 2022).
The pre-COVID literature on working from home is large and covers multiple disciplines as summarized by Allen et al. (2015), with a focus on how effective it is for both employers and employees. The pandemic allows us to see the impacts of an abrupt change in work behavior and we focus on individuals. Our contribution is the use of data collected over two waves one year apart, allowing us to measure changes over that time period, albeit both during winter COVID peaks. Our focus is on examining the individual determinants of increased working from home during the pandemic and the desire to continue to work from home in the future.
Data
Data Collection
We add to the rapidly developing picture of working from home both during the pandemic and in the future using data from two weighted population-representative on-line panel surveys conducted in the State of New Jersey. The data were gathered to capture changes in travel and travel-related behaviors during the COVID-19 pandemic, as well as to give insights as to what we might expect as the pandemic subsides. We commissioned Qualtrics online panels, specifying quotas based on age, gender, income, and race of respondents to assemble a sample representative of New Jersey based on these characteristics. Respondents were screened to ensure that they were living in New Jersey at the time they filled out the survey and that they were at least 18 years old.
We collected 1,419 responses in the first wave between November 30th, 2020 and February 25th, 2021 and 1,032 responses in the second wave between December 1st, 2021 and February 22nd, 2022 (while we define these as waves, online panels do not necessarily include the same respondents). We have made the data and questionnaires for each survey available open-source (Noland et al., 2020, 2021, 2022; Noland, Younes, et al., 2023a). The first survey coincided with the worst of the pandemic across the United States as well as in New Jersey while the second survey coincided with the rapid increase in cases due to the Omicron variant. Our original intent, in both cases, was to collect data post-pandemic, however, this unfortunately was not the case, but does provide an opportunity to assess behavior during the worst two waves of the pandemic. Table 1 displays weighted summary demographic statistics for each survey, with corresponding percentages from the U.S. Census Bureau for the overall and employed population (American Community Survey 5-Year Estimates (2016-2020), 2020).
While the surveys were intended to be representative of the New Jersey population, we found that the older age group cohorts were particularly underrepresented. This prompted us to use the software PopGen (Konduri et al., 2016; MARG., 2016) to generate survey weights to obtain more representative survey results. PopGen uses the entropy optimization method (Bar-Gera et al., 2009; Ye et al., 2009) to create weights for the survey to represent the population, with the capacity to match both household and person-level characteristics. For this study, we only controlled person-level characteristics, as the surveys were conducted at the individual level rather than household level. Specifically, we used the New Jersey state level distributions of population age, gender, income, and Hispanic identification, collected from the American Community Survey (American Community Survey 5-Year Estimates (2016-2020), 2020), as the marginal controls to expand the survey samples. One limitation is that we did not have a representative sample based on education level and could not include in our weighting due to differences in how the question was asked. Likewise, we could not weight on race as the definitions used differed from the Census. While we applied weights to interpret summary statistics and cross-tabulations, the interpretation of results did not differ substantially from the unweighted sample.
Survey Content
Our surveys included questions about a variety of behaviors and perceptions, both during and after the pandemic. These questions focused on five major areas: 1) Work and school, 2) Shopping and dining, 3) Active travel, 4) Transportation and commuting, and 5) Attitudes and perceptions. We also asked respondents about their expectations for life when COVID-19 is no longer a threat. Additional analysis of the survey content has examined outdoor dining, active travel, and grocery shopping (Noland, Iacobucci, et al., 2023; Younes et al., 2022, 2023a, 2023b).
Concerning working from home, we gathered information from respondents using a variety of different questions. First, we asked respondents—for both before and after the pandemic—how often they worked (or expected to work) from home on a five-point scale, ranging from “Never” to “Every Day”. Second, we asked respondents about their primary commute mode, both during the pandemic and how they anticipated commuting post-pandemic, including an option for working from home. Finally, we asked respondents more specifically about their frequency of working from home both during and after the pandemic by having them indicate the number of days in the past week they worked from home during the pandemic, ranging from 0 to 7, as well as how many days per week they expected to work from home when COVID-19 is no longer a threat. Our analysis includes both descriptive results and a multi-variate regression to assess factors associated with working from home now and in the future.
Results
Descriptive Results
Working from Home Before, During, and After the Pandemic
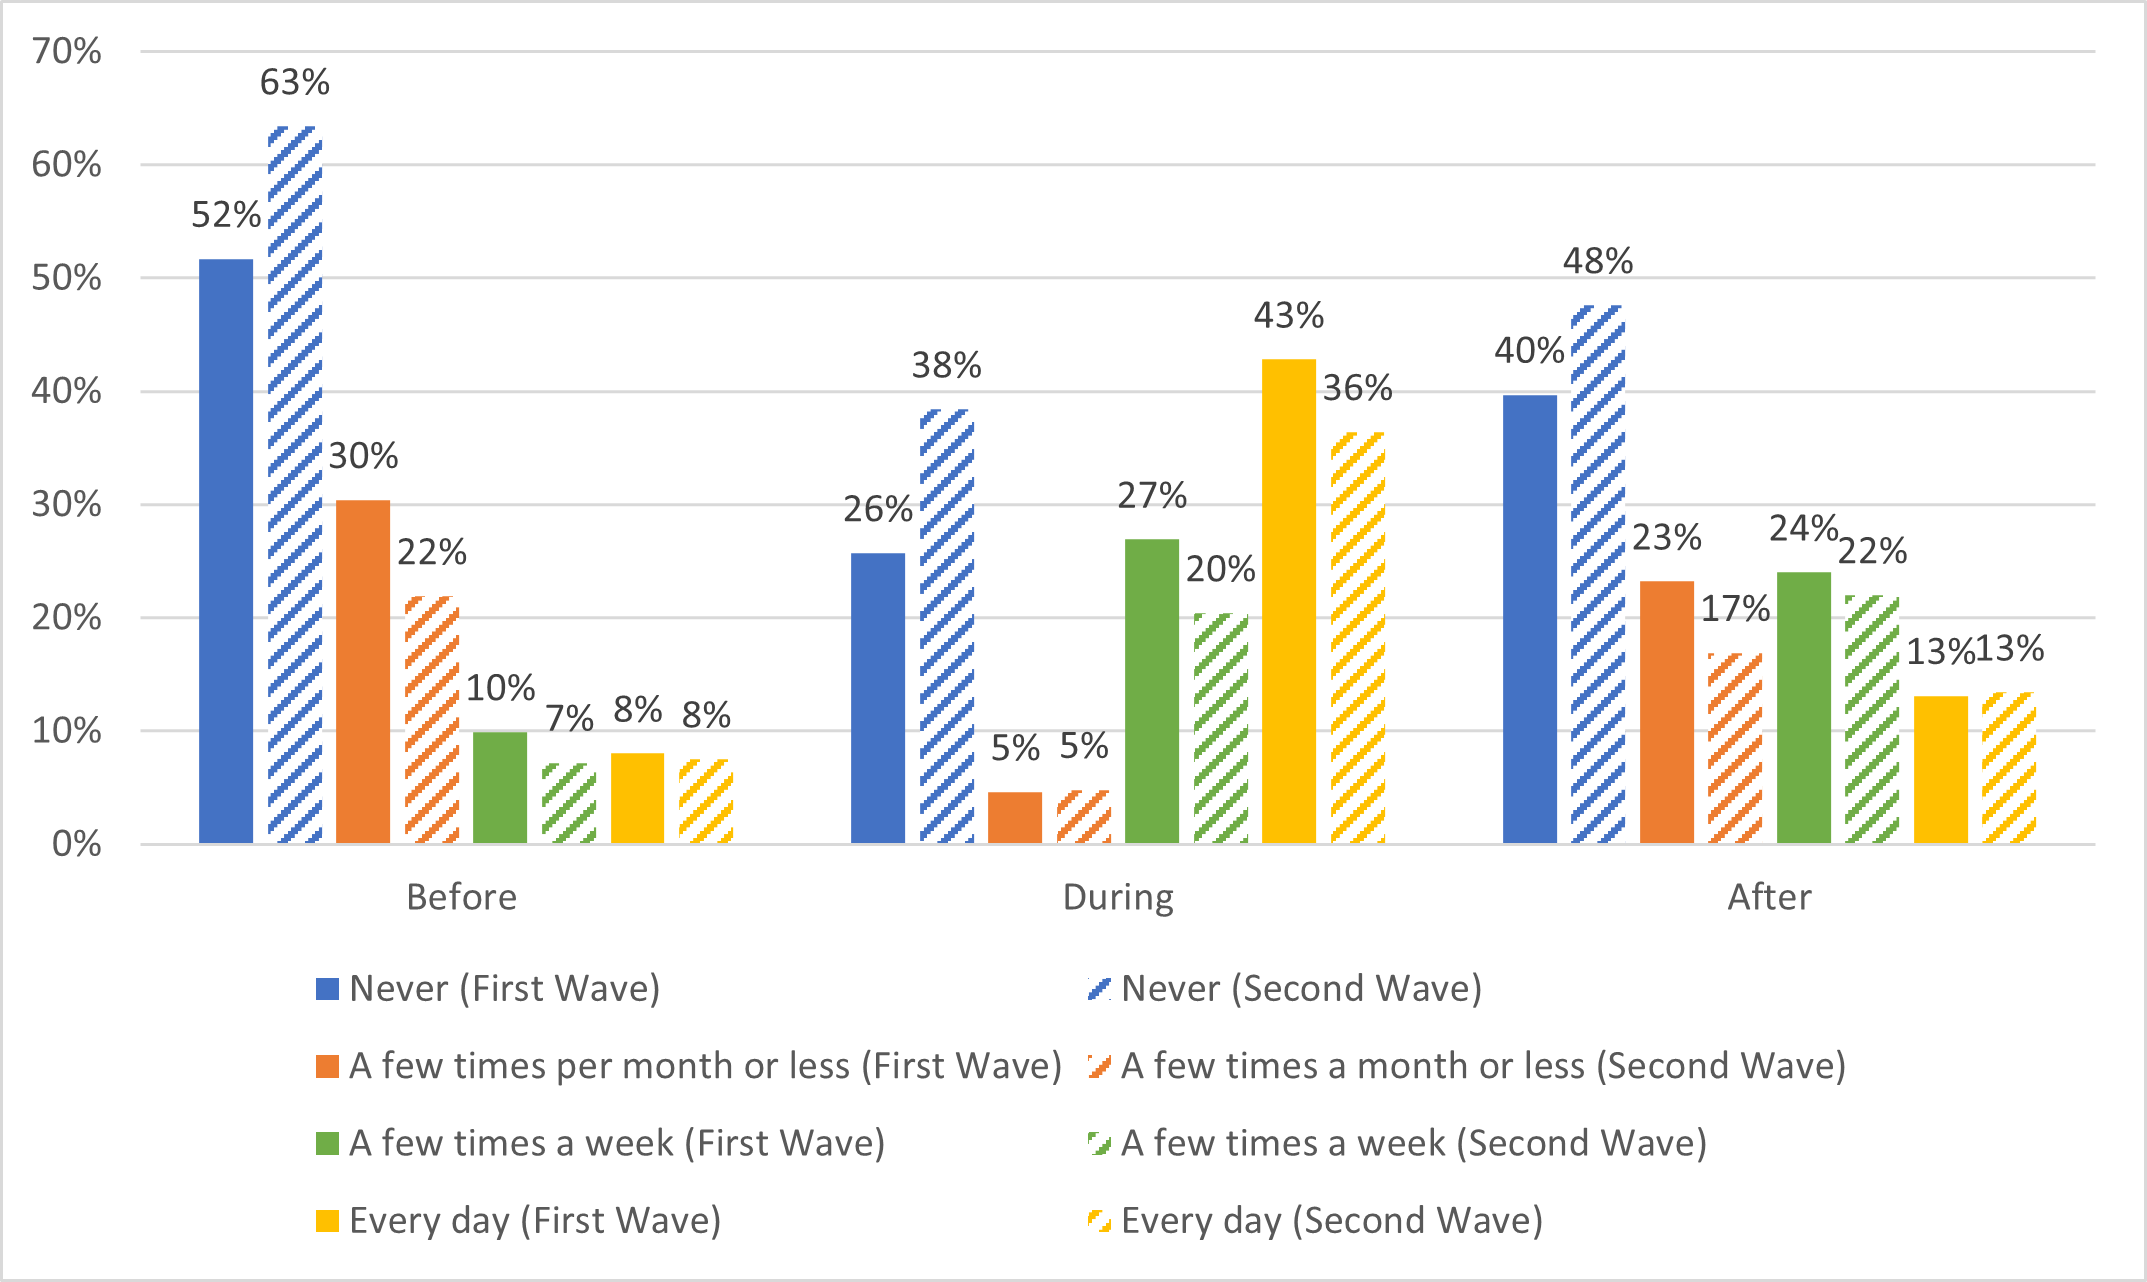
On aggregate, we observed substantial changes in the frequency of working from home before the pandemic, after its onset, and in terms of respondents’ expectations moving forward. Figure 1 shows the breakdown of the frequency of working from home before, during, and expectations after the pandemic. This includes only respondents who were employed either full- or part-time when they filled out the survey (n = 936 for the first wave and n = 732 for the second wave).

We used different question structures for assessing working at home before the pandemic, during, and for the future. For the “before” category, respondents were presented five choices, “never”, “a few times a year”, “a few times a month”, “a few times a week”, and “every day” in response to the question “Before the COVID-19 pandemic, how often did you usually work from home?”. We combined those reporting “a few times a year” with those reporting “a few times a month”, i.e., these are relatively infrequent telecommuters.
The second set of bars shows the frequency of working from home during the pandemic. This is based on asking respondents “In the past seven days, how many days did you work or attend school from home?”; this was asked of both those who worked and those who attended school, but the latter are not included in this analysis. We assume that those reporting zero days, never work from home, while those reporting one day a week work “a few times a month”. Those who reported working 2-4 days a week were classified as “a few times a week”, while anyone reporting five or more days was classified as “every day”.
For respondent expectations after the pandemic we asked “After COVID-19 is no longer a threat, how often do you think you will work from home?” Response categories were the same as for the “before” question, but also included an “I don’t know” response. Some 8.9% of respondents of our first survey and 8.2% of our second survey indicated that they do not know; these respondents are excluded in the percentages shown in Figure 1.
Figure 1 displays the New Jersey population weighted responses. The frequency of never working from home prior to the start of the pandemic ranged between 52-63%; surprisingly more respondents indicated they did not work from home pre-pandemic in our second survey. While this may be a random variation in the result it could also reflect not remembering pre-pandemic work behavior.
This discrepancy between survey waves in reporting “never” remains for responses during and after the pandemic compared to the first survey. This may reflect actual changes in behavior as many employees may have started working in-person despite the Omicron variant surge (from December 2021 through February 2022) when the survey was deployed. The increase in reporting “never” post-pandemic, may simply reflect fatigue with working at home among those who have found it difficult.
Around the same proportion of people worked from home at least a few times a week before the pandemic (18% for the first survey and 15% for the second survey). An interesting, but expected, difference is the amount of people who worked from home during the pandemic in December 2020 versus December 2021. Seventy percent of the first sample worked from home at least two days a week, compared to 56% of the second sample, a year later. This may also be due to the differences in the survey respondents, more responded that they did not have the option to work from home before the pandemic began (65% in the first wave compared to 56% in the second wave). Nonetheless, responses for future expectations are about the same between the first and second wave. Thirty-seven and thirty-five percent of the respondents to each survey reported that they expected to work from home at least a few days a week after the pandemic subsides. For the first and second surveys, this represents a 19 and 20 percentage point increase, respectively, in working from home at least a few days a week post-COVID, compared to before COVID – increases of more than two-fold. Thus, while the “never” response increased, we find that perhaps some fraction of our respondents found working at home preferable to commuting in the future.
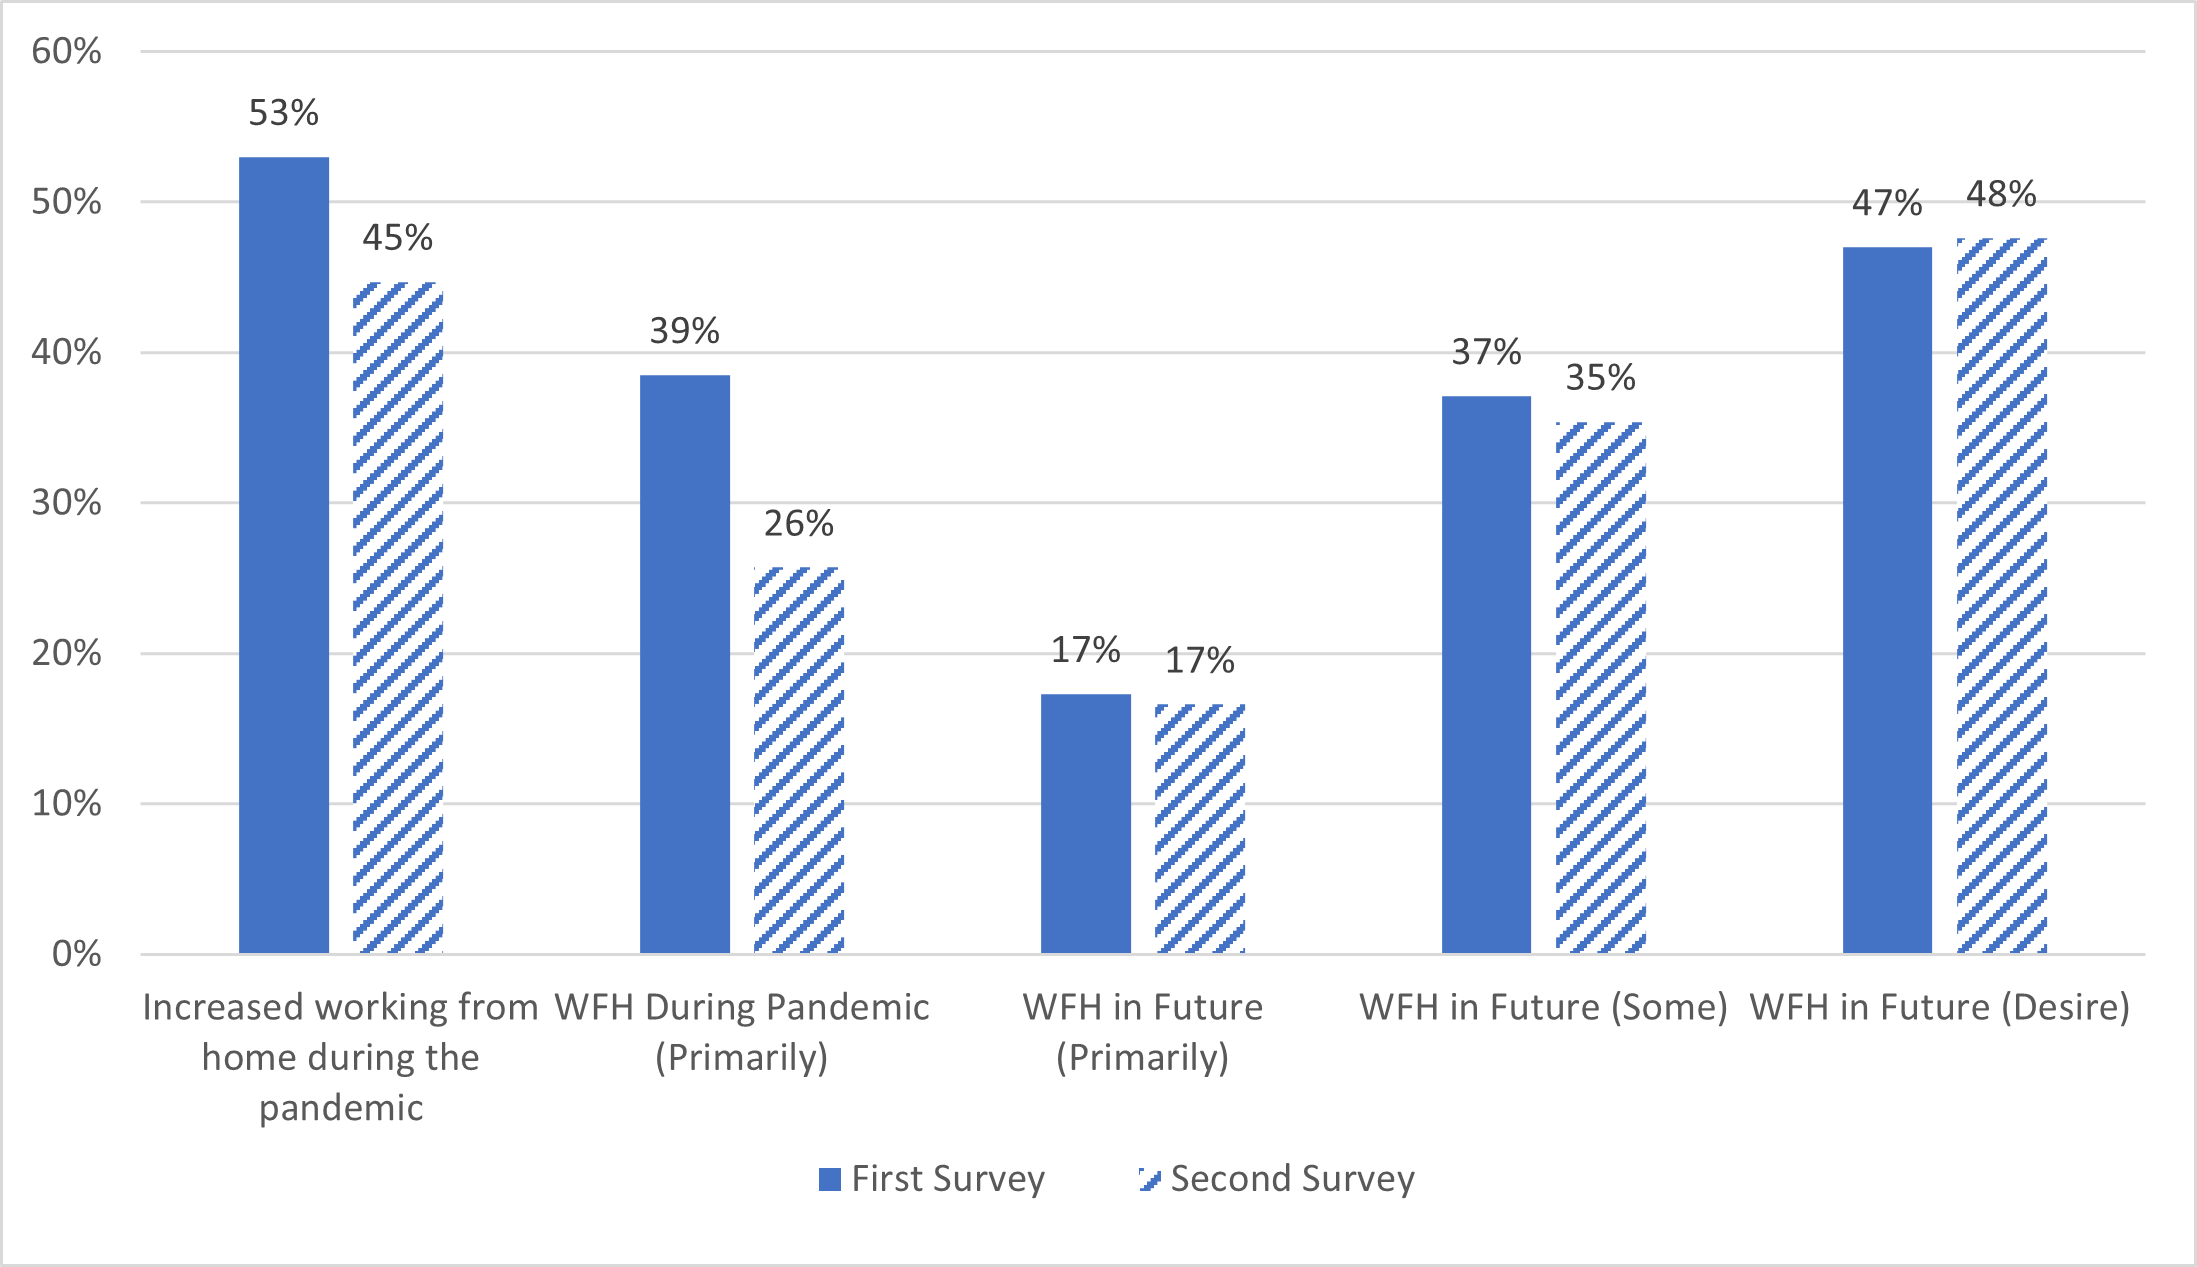
Changes in working from home and the future of working from home
We also sought to understand how many people increased working from home during the pandemic, how many were able to primarily work from home during the pandemic, as well as how these experiences would play out in the future. Figure 2 displays these results based on various questions from our surveys. The first two columns represent those who decreased the number of days per week they worked away from home during COVID versus before COVID. The questions were: “How many days a week did you travel to work or school before the COVID-19 pandemic?” and “In the last seven days, how many days did you travel to work or school?”. Those who decreased working away from home (i.e., increased working from home) are represented by the first set of bars.

Those who were able to primarily work from home during the pandemic (i.e., their primary “commute” was to stay home) was based on the question “On a typical day now, how do you most often travel to work or school?”. This was asked of respondents differently than for the responses shown in Figure 1. Respondents were provided with a selection of travel modes that included “I am working/studying at home” (this is also the question we use in our binary logit model as the dependent variable). Results are shown in the second set of bars in Figure 2.
Those who expect to continue to primarily work from home after the pandemic, and those who expect to work from home at least a few times a week (some), are also shown in Figure 2 (third and fourth set of bars). For those planning to primarily work from home in the future we again asked about how they plan to travel in the future providing a selection of travel modes to choose from in response to: “After COVID-19 is no longer a threat, how do you expect to most often travel to work or school?”.
Another question was phrased as “After COVID-19 is no longer a threat, how often do you think you will work from home?” For those who responded “a few times a week” or “every day” to this question we classify as reporting that they will work at home some of the time in the future. (shown in the fourth set of bars in Figure 2 and equivalent to the last two sets of bars shown in Figure 1.
Finally, for those who expressed a desire to work from home some of the time we provided the following question: “Which of the following experiences (if any) have you had during the pandemic that you would most like to continue after COVID-19 is no longer a threat?”. Among the responses presented was that they would like to continue to work from home at least some of the time; regardless of whether they expect to be able to.
While there is some variation in how these responses were obtained, they provide a good overview of how we expect working from home to change in the future. Over a third—38.5%—of respondents from the first survey (December 2020) reported primarily working from home during the pandemic. A year later, a quarter still reported primarily working from home. The expectation and desire to work from home in the future was consistent between the first and second survey, despite the drop in respondents currently working from home. About 17% in both surveys report that they would continue to work primarily from home after COVID-19 was no longer a threat. In addition, while the two surveys did not include a question about work from home as a primary mode before the pandemic, the figure of 17% is still twice the 8% of respondents who said they worked from home “Every day” before the pandemic (Figure 1), indicating a substantial increase, and this is consistent in both surveys.
Additionally, 37.1% and 35.4% of employed respondents in the first and second survey, respectively, indicated they would work from home at least some of the time after COVID-19 was no longer a threat, with “some of the time” defined as at least a few times per week. This figure approximately doubles the 15-18% of working respondents who said they did so before the pandemic and is approximately half the 70% who worked from home at least a few times per week in December 2020 and two thirds of the 56% who worked from home at least a few times per week in December 2021.
Finally, nearly half of employed respondents in both surveys (47-48%) indicated that they would like to work from home at least some of the time after the pandemic. This desire differed significantly by both their reported recent experience working at home (in the prior seven days) and whether they reported being able to work at home prior to the pandemic. These results are shown in Table 2 and Table 3. As can be seen those who report working from home in the prior seven days are more likely to report a desire to do so in the future, relative to those who have not worked at home in the prior seven days. Similarly, those who reported that they could not work from home prior to the pandemic have a lower desire to do so in the future, compared to those who reported that they could work at home pre-pandemic. While most percent values in each cell are similar between the two survey waves, there is a shift to a greater desire during the 2nd survey for those who reported being able to work from home before the pandemic (from about 59% to nearly 75%), perhaps suggesting that experience led to a greater desire to continue working at home.
One plausible interpretation of these results is that people who experienced working from home during the pandemic typically wanted to continue working from home, at least sometimes, though some did not foresee having the opportunity to do so. This interpretation would explain why the rates of wanting to continue working from home were higher than anticipated rates of actually working from home after the pandemic. This interpretation is supported by the reasons people gave for not working from home. When employed respondents indicated they would “Never” work from home after the pandemic (n = 335 and n = 314), we asked them why not, allowing them to select from two primary reasons. The majority stated that the job they had was not suitable for working from home or that their employer would not allow it, while only 17.6% of respondents for the first survey and 11.8% of respondents for the second survey responded they “do not like working at home”. In short, more people will not work from home due to constraints related to their employment rather than out of personal preference.
Differences by Gender
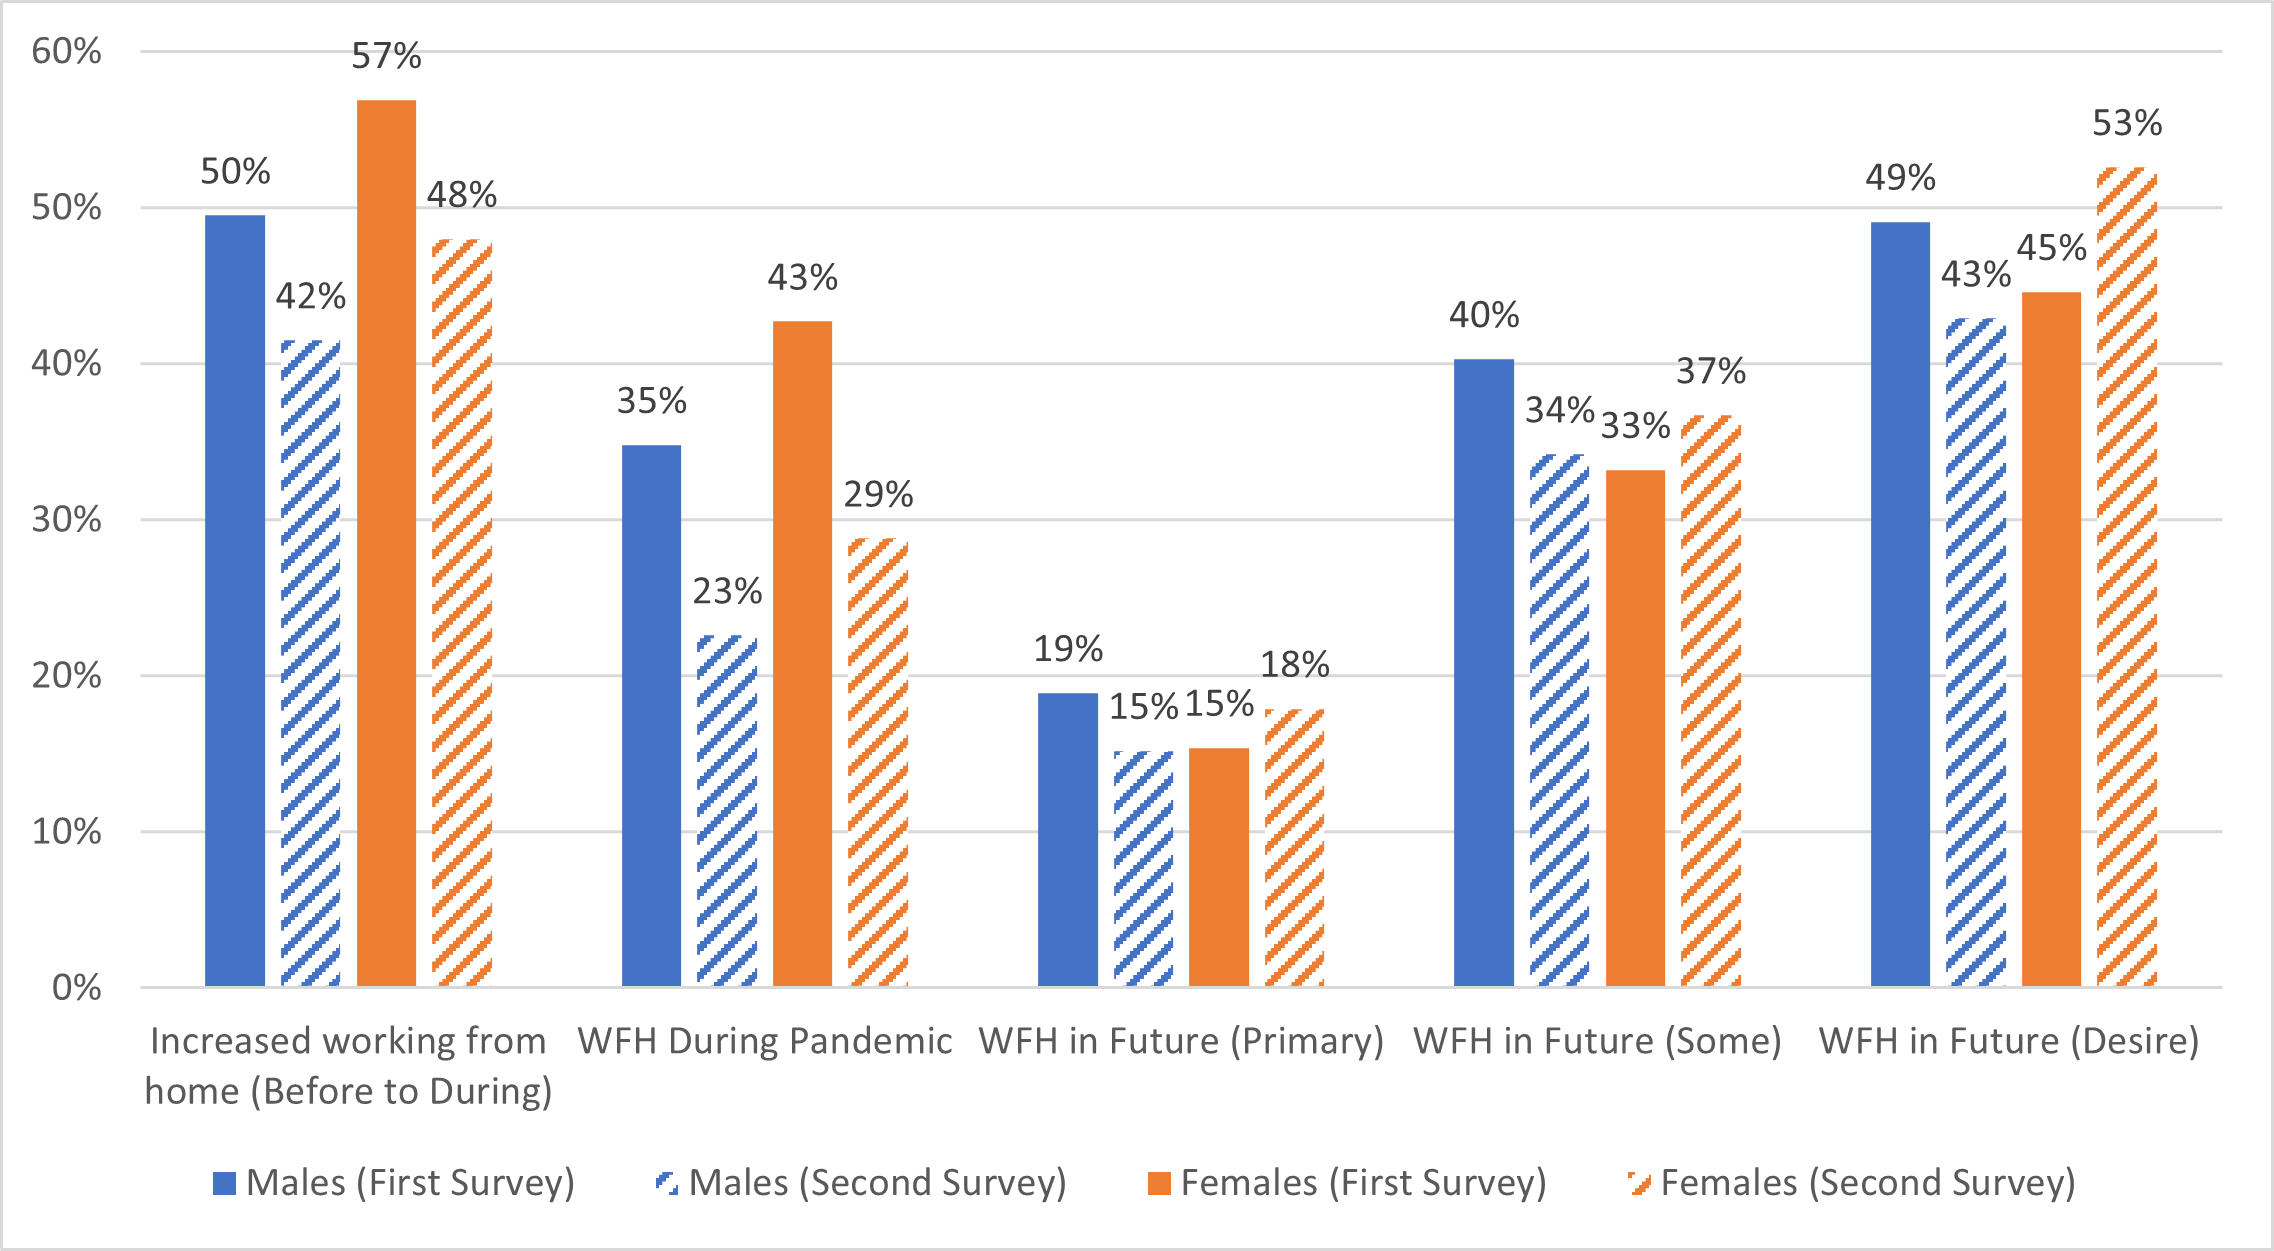
In many cases, women tended to be disproportionately affected by working at home, compared to men. This was mainly because women would also be responsible and take charge of domestic chores and childcare (Abromaviciute & Carian, 2022). The unavailability of daycare and the unreliability of being able to send children to childcare created burdens on all families who needed to work at home. Likewise, all children needed to be engaged in online schooling, and this was more difficult with younger children. Some of these restrictions were less severe during the second wave of our survey (despite coinciding with the second winter surge in cases). So how did these circumstances affect working at home and the desire to do so?
Figure 3 shows the breakdown of working from home by gender. This shows that women were more likely to increase working from home relative to men with about a 7% difference. Results from the second survey show a smaller proportion of respondents increased working from home relative to before the pandemic for both genders. The proportion of women who worked primarily from home during the pandemic was around six percentage points higher than that of men in both of our samples, although the proportion of people working from home decreased in the second wave.

In terms of expectations for after the pandemic, however, the first survey showed that men expected and desired to work from home more than women did – a trend that reversed in the second survey, where women were more likely to report expecting and desiring to work from home. We hypothesized that the dynamic depended on having children in the home. Women were more likely to bear the weight of having to care for children being at home in 2020 (Abromaviciute & Carian, 2022). By December 2021, most schools and daycares had reopened and children were able to attend full time, thus allowing parents to work from home more easily, though schools and daycares often shutdown unexpectedly when there was a positive COVID test result. We have included a cross tabulation table of the desire to work from home in the future depending on gender and having children at home in the supplementary material (Table S3). Results confirm that women with children were much less likely to desire working from home in the first survey compared to the second survey (42% versus 55%).
Working from Home and Attitudes towards COVID
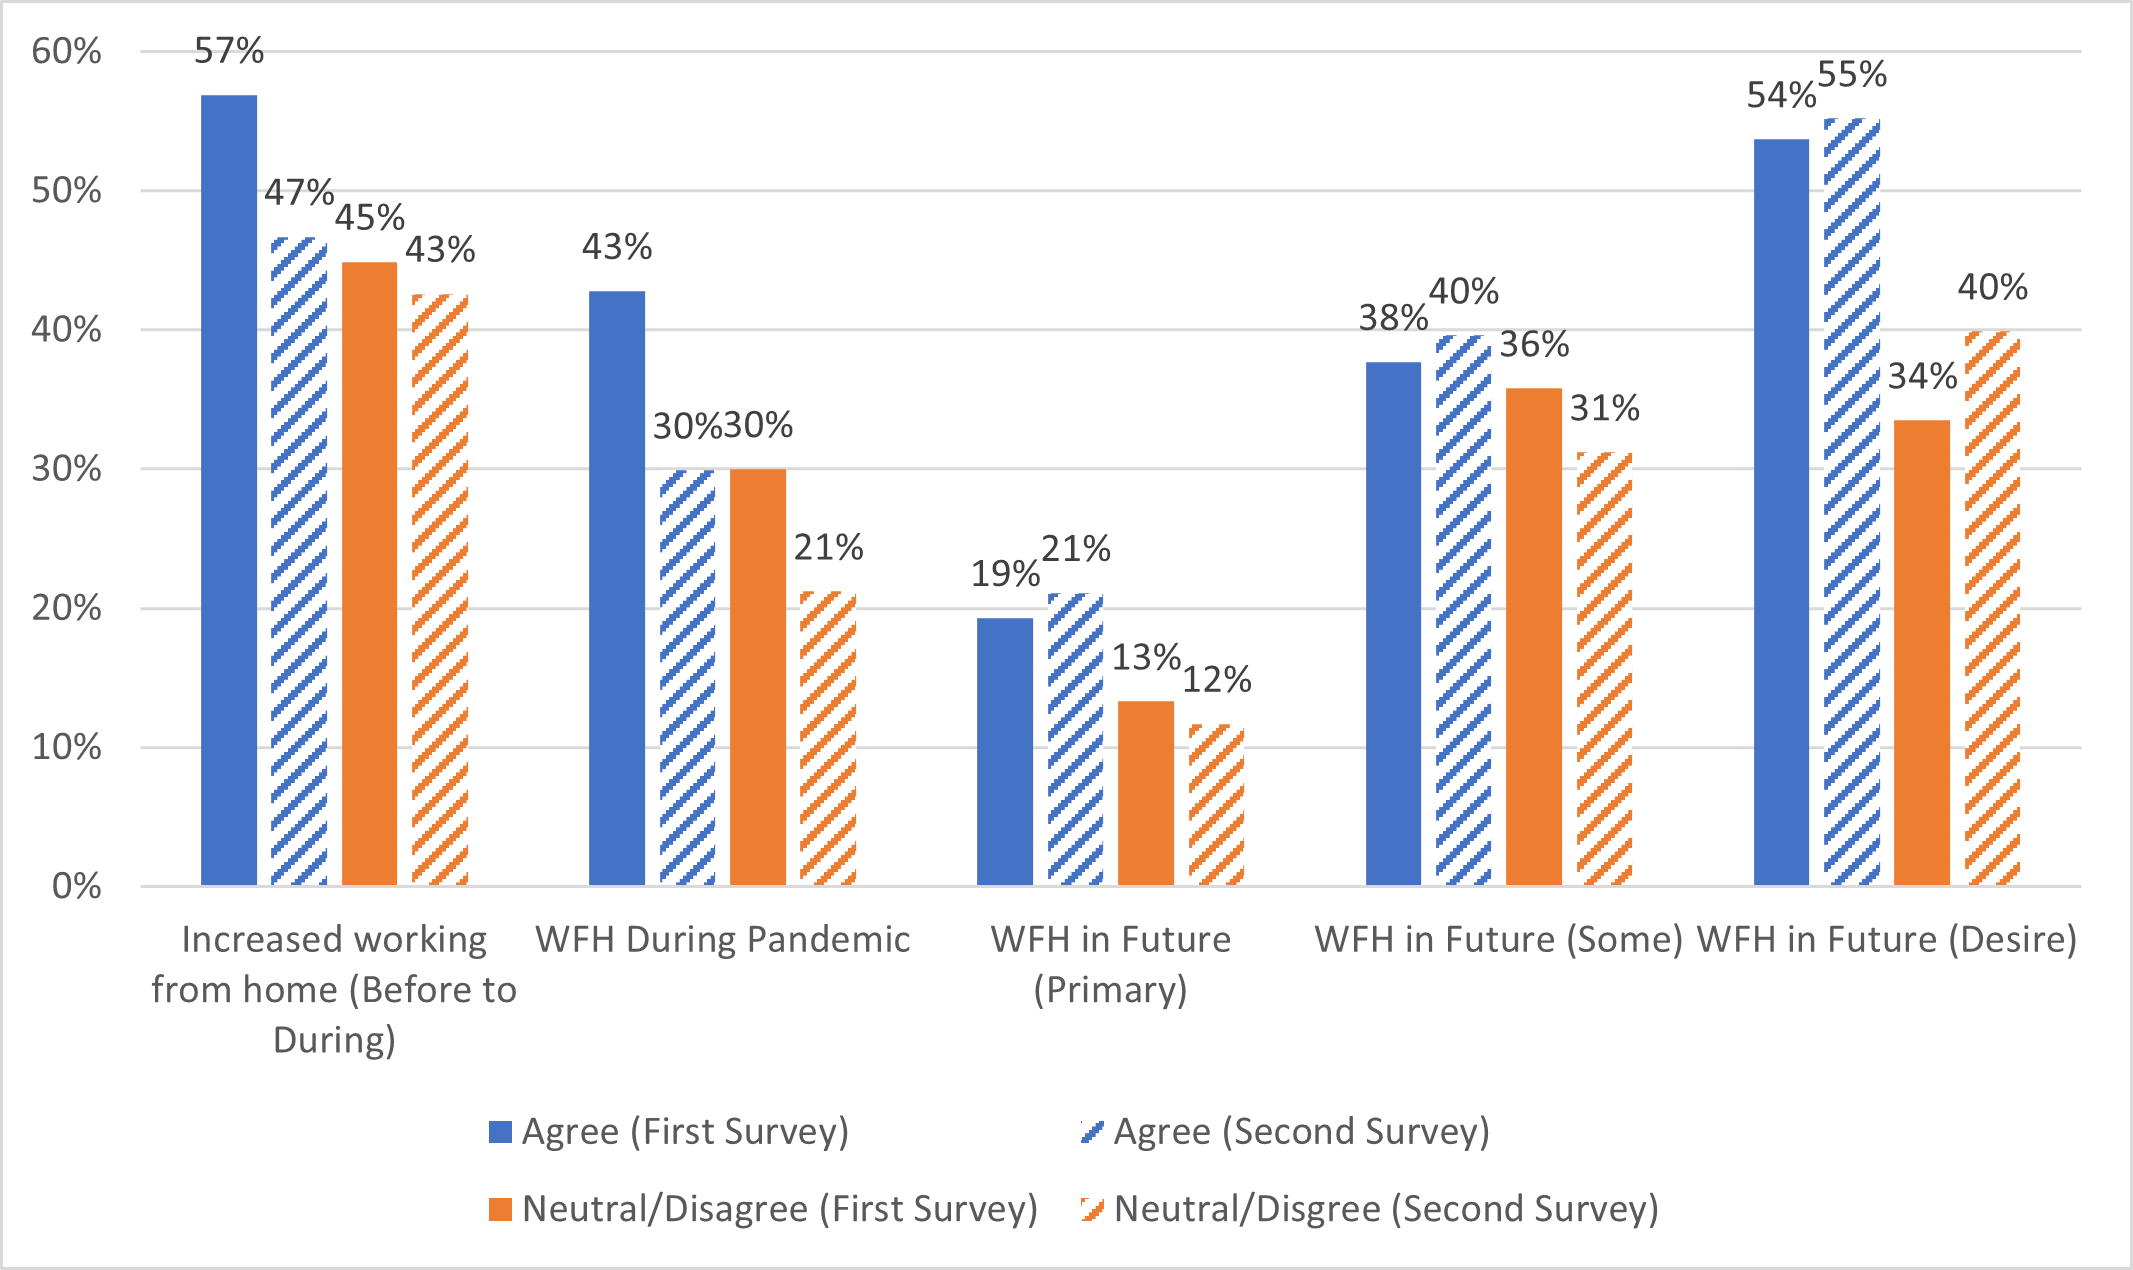
Figure 4 shows propensity to work from home based on respondents’ agreement with the idea that people should stay home as much as possible while COVID-19 is still a threat. Those who agreed that everyone should stay home as much as possible while COVID-19 is still a threat were substantially more likely to report an increase in working from home (57% vs. 45% for the first survey and 47% vs. 43% for the second survey). The same is true of those who reported working from home (43% vs. 30% for the first survey and 30% vs. 21% for the second survey). These differences were muted when it came to future expectations, however, those who agreed with the practice of staying home as much as possible were nearly 20 percentage points more likely to desire to continue working from home.

Regression Models
To better understand the propensity to work from home, we developed a series of binary logistic regression models: one for the change in working at home from before to during the pandemic, and three for working from home in the future (primarily, some, and based on reported desire). Table 4 shows a binary logit model in which the dependent variable is whether respondents increased working from home during the pandemic or not. We excluded people who indicated that they already worked from home full time prior to the pandemic (i.e., answered that they traveled to work 0 days per week).
Increases in working from home during the pandemic are associated with educational level, attitudes towards the pandemic, and commute length before the pandemic. Gender and race were not statistically significant after controlling for all other factors. Those aged 50 or older were less likely to increase working from home than other age groups. Not having children present in a household was associated with increased working from home in the first survey, but not in the second survey. Educational level was positively correlated with increasing the amount of working from home.
We also controlled for attitudes, performing factor analysis on a set of seven questions regarding people’s feelings towards the pandemic (Younes et al., 2022). The resulting categories were: the believers, the fearful, and the deniers. The full factor loadings for each survey, along with the questions used, are available in the supplementary material (Table S1 and S2). Those classified as deniers were more likely to agree that “society is overreacting to the coronavirus” and that “shutting down businesses to prevent the spread of the coronavirus is not worth the economic damage that will result” and more likely to disagree with “everyone should wear a face mask when they are near other people” and “everyone should stay home as much as possible until the pandemic has subsided”. Those classified as “believers” had high loadings on questions associated with believing people should stay at home and wear face masks. We did not use the “fearful” factor in our analysis as it was correlated with other variables. The factor scores are continuous variables with positive scores indicating each respective category. We classify “deniers” as those that have a value greater than 0. Those who did not deny the pandemic were more likely to increase working from home than those who denied the pandemic for the first and second survey, respectively.
We also found that those who had a long commute (one hour or longer) before the pandemic were nearly twice as likely to increase working from home (based on calculating an odds ratio from our coefficient estimates: 2 and 1.8 for the first and second survey, respectively).[2]
Looking to the Future
Next, we estimated a series of models to help understand respondents’ expectations for the future. Table 5 shows six models, one for each survey for three variables: a) if respondents expect to primarily work from home after the pandemic subsides, b) to work from home at least a few times a week when the pandemic subsides, and c) if respondents would like to continue working from home after the pandemic subsides, regardless of if they think they will or not.
A few results stand out as being especially significant. Having the option to work from home before the pandemic and actually working from home (at least three days a week) during the pandemic were the largest predictors of planning and desire to work from home in the future. In the models depicting expecting to work from home primarily or some of the time in the future, we did not find any patterns in terms of socio-demographics or attitudes towards COVID-19. After controlling for the ability to work from home during the pandemic, which itself is likely correlated with education, none of the demographic variables were consistently significant.
The regression depicting the desire to work from home yielded more interesting results. Regardless of whether they expected to in the future, more highly educated respondents (bachelor’s degree and above) were associated with having a higher desire to work from home. In the second survey, women were far more likely than men to desire working from home – although that was not seen in the first survey, likely because of the burden of child care while working from home in late 2020, which is negatively associated with desiring to work from home in the first survey. Interestingly, those who “deny” the pandemic were less likely to desire working from home in the future. Having a long commute before the COVID-19 pandemic was not associated with the desire to work from home (Table 5), but was associated with working from home during the pandemic. We show in Table 4 that commute distance was associated with working from home during the pandemic. We also tested how those who commute by public transit were affected; the result was similar to those with long commutes and the variables were highly correlated, so we omitted this variable from the analysis.
Discussion and conclusions
In this study, we sought to investigate (1) the prevalence of working from home during the pandemic, (2) who increased working from home during the pandemic, (3) what factors contributed to increasing working from home during the pandemic, (4) the future of working from home in a post-pandemic era, and (5) the conditions associated with the future of working from home. While the surge in teleworkers was initiated by the pandemic, the sustained uptake in working from home will depend on two primary factors: 1) whether employers allow it, and 2) whether workers demand it (Handy & Mokhtarian, 1996). Early telecommuting research suggested that technological advances would trigger an uptake of working from home. In retrospect, these advances seem to have been necessary—but not sufficient—conditions to drive wider adoption of working from home. Our results suggest that the pandemic has unleashed the demand for working from home among workers who can do their jobs in this way. We also provide some indication that while some workers do not anticipate their workplaces accommodating their desires, a substantial contingent of people expect to work from home. Based on the results of two surveys administered one year apart and with different samples,[3] the number of people who expect to work primarily from home after the pandemic roughly doubled compared to the number who did so every day before the pandemic, and the number of people who expect to work from home at least a few times a week seems on track to double as well.
The changes suggested by our results, however, do not apply evenly across all workers. Among the most powerful predictors of working from home in the future were having the option to work from home before the pandemic, as well as working primarily from home during the pandemic. In turn, education level seems to be strongly associated with working from home, largely—we suspect—because the jobs that offer the option to work from home, and that accommodated this practice during the pandemic, typically require substantial educational attainment. In this way, to the extent that educational attainment is unevenly distributed among the population, so will be the opportunity to work from home as this practice grows.
Attitudes towards the pandemic, specifically those we classify as “deniers” of the pandemic, had some correlation with desiring to work from home in the future, although not with the expectation to do so. That is, those who denied the pandemic were not less likely to expect working from home in the future, but they had a lesser desire to do so than other groups.
Our multivariate results show no significant differences between white, black, and Asian respondents. The same appears true of different age groups, and in both cases, it may be that educational levels account for differences among these groups in their future ability and desire to work from home.
Our focus was on assessing whether working from home would persist after the pandemic. While stated preference surveys have limitations, other work assessing what might happen in the future is generally consistent with our findings. Similar to our work, Salon et al. (2022) fielded a large national survey during the pandemic, so actual post-pandemic long term effects represent the desires of those surveyed and may not correspond to actual practice when the pandemic is long behind us. They found that the propensity to telecommute has increased with 40-50% of those working expecting to continue to do so some of the time. Of those that expect to have the option to telecommute in the future, some 25-30% of their sample expect to so in the future. They also found that those new to telecommuting and gained experience telecommuting are likely to continue to do so if given the option by their employers (Salon et al., 2022). Other speculative work includes de Haas et al. (2020), in their Dutch survey, finding a similar shift, as did Conway et al. (2020), Barrero et al. (2021), and Barbour et al. (2021).
Our results demonstrate, not unexpectedly and in line with other research, that working from home saw a substantial increase during the pandemic. One of our contributions is that we conducted our survey during two different points in time, as did Salon et al (2022). While demographic associations with increasing working at home are relatively weak, individuals who have higher income and greater educational attainment were more likely to increase working from home. Long commute times before the COVID-19 pandemic were associated with increased working from home. Older respondents (50 years and older) and those classified as “deniers” (i.e., disagreeing with wearing a mask, not staying inside, not fearing being ill, etc.) were associated with a decreased likelihood to increase working from home during the pandemic. Our results demonstrate that many employees have a desire to continue to work at home, at least some of the time. This has implications for how employers manage their workforce. Return-to-work mandates have been shown to decrease employee satisfaction (Ding & Ma, 2023). We recommend based on our findings—and in conjunction with Ding & Ma’s (2023) preliminary work—that employers use caution before imposing return to work mandates, or at least consider hybrid policies. There are also implications for transportation planning. Peak congestion periods may decrease, though use of public transit may also, with concerns over transit revenue. Future work is needed to validate whether these expectations will become reality. Survey research aimed at monitoring changes in work behavior and employer responses can help to understand the state of working from home in a post-pandemic period. While concerns over the “end of the city” are overblown, there could still be impacts on establishments dependent on activity in central business districts. As of this writing, it is unknown how long these conditions will persist and working from home is largely dependent on employer policies allowing more flexibility for those capable of working at home, for better or worse.
Author Contribution Statement
The authors confirm contribution to the paper as follows: study conception and design: Younes, Noland, Iacobucci, Zhang; data collection: Younes, Noland, Iacobucci, Zhang; analysis and interpretation of results: Younes, Noland, Iacobucci, Zhang; draft manuscript preparation: Younes, Noland, Iacobucci, Zhang. All authors reviewed the results and approved the final version of the manuscript. The author(s) do not have any conflicts of interest to declare.
Acknowledgement and Disclaimer
We thank the New Jersey Policy Lab and the Bloustein Healthy Communities fund for providing funding. While the New Jersey Office of the Secretary of Higher Education (OSHE) administers the partnership that funds the New Jersey State Policy Lab, these findings do not necessarily represent the policy or endorsement of OSHE or the state of New Jersey.