INTRODUCTION
This study investigates the relationship between government-guaranteed small business lending and employment growth, particularly in lower-income and minority communities, from 2010 to 2016. The role of small businesses in fostering economic growth and reducing unemployment is widely recognized, making their access to credit a central concern for both researchers and policymakers. The Small Business Administration (SBA) loan programs have been integral in facilitating credit access for small businesses, particularly those that might not otherwise obtain financing with reasonable terms and conditions. Yet, despite the policy importance, empirical evidence on the effectiveness of SBA loan programs in promoting economic growth and reducing unemployment is mixed, warranting further investigation. Some research suggests that SBA-guaranteed lending programs yield positive social benefits, such as per capita income and employment growth at the local market level (Brown & Earle, 2017; Cortes, 2010; Craig et al., 2007, 2008). Conversely, others argue that SBA-guaranteed lending programs have little impact on income or employment improvement in the loan recipient areas (De Rugy, 2007; Higgins et al., 2021; Y. S. Lee, 2018; Rupasingha et al., 2019). Moreover, given the historical and ongoing racial and ethnic disparities in access to credit, there is a crucial need to understand whether SBA loans have been effective in promoting employment growth in low-income and minority communities.
Therefore, this study aims to address gaps in the literature by providing separate estimates for the impacts of the SBA’s 7(a) and 504 programs, which have often been analyzed collectively, potentially masking the impacts of the lesser represented 504 loans. The study also expands the timeframe of analysis to 2010-2016, a period underrepresented in the existing literature. Additionally, the study investigates the economic outcomes of counties with higher volumes of small business loans, particularly those with a greater volume of SBA 504 loans, which emphasize employment growth and job retention. It also explores whether SBA lending has a more significant impact on low-income or minority-dominant counties. Given the frequent intersectionality of low-income and minority communities, the study also examines the employment effects of SBA loans in low-income minority communities, an area where double discrimination may occur.
BACKGROUND
The Small Business Administration Loan Program
Established during the post-World War II era amidst a burgeoning consumer culture and a need to invigorate small business development, the SBA has become an essential pillar in the U.S. government’s strategy to bolster entrepreneurship and support small businesses. Central to its mission are the 7(a) and 504 loan programs, which play crucial roles in spurring growth, employment, and economic development within the small business sector.
The 7(a) loan program, often considered the SBA’s marquee initiative, provides financial support to small businesses unable to secure financing under reasonable terms from traditional avenues. The program embodies the SBA’s broad policy objectives of fostering small business growth, employment, and economic development. In its inception, the 7(a) loan program emerged as a response to the market failures leading to insufficient capital allocation to small businesses. Under the 7(a) loan program, the SBA guarantees up to 85% of loans up to $150,000 and 75% of loans greater than $150,000 made by partnering lenders, which may include banks, credit unions, and other financial institutions. This federal guarantee reduces the risk to the lender, thereby encouraging them to provide loans to small businesses that might otherwise be considered too risky. The loan funds can be used for a variety of purposes, including working capital, refinancing existing debt, purchasing real estate or equipment, or even buying a business. This flexibility reflects the SBA’s recognition of the diverse needs of small businesses and the barriers they face in accessing traditional credit markets.
In a similar vein, the SBA 504 loan program seeks to promote economic development through job creation and retention. The 504 program is specifically designed for the long-term financing of fixed assets like real estate or heavy machinery, catering to the needs of small businesses aiming to expand their operations but struggling to secure long-term, fixed-rate financing. The 504 loans cannot be used for working capital or inventory, underscoring the program’s explicit focus on job creation and retention via physical capital expansion. For instance, borrowers are generally required to create or retain one job for every $65,000 guaranteed by the SBA, illustrating the program’s policy focus on stimulating job growth through small business expansion.
Understanding the 7(a) and 504 loan programs in this detailed context helps shed light on the mechanisms through which SBA loans may impact economic and employment outcomes and the potential reasons behind the variations in their effectiveness. It also underscores the significant role the SBA plays in addressing the capital access issues faced by small businesses.
LITERATURE REVIEW
Economics of Government Interventions in the Small Business Credit Market
In a complete capital market, firms should be able to borrow enough capital as long as they pay reasonable interest rates. In practice, however, small business owners often complain of not being able to secure sufficient credit, even if they are willing to pay higher interest rates. Economic theorists have suggested several mechanisms to explain the failure of the private sector to allocate loans efficiently. In their 1981 article, Stiglitz and Weiss argued that difficulties in obtaining adequate information about the parties involved in a transaction may explain the inefficient allocation of small business loans. Specifically, lenders are concerned about the interest rates they receive on loans and the risks associated with those loans. Lenders who raise their interest rates may suffer from adverse selection because higher interest rates increase the loan risk by either discouraging safer borrowers or inducing borrowers to invest in high-risk projects. Accordingly, lenders may choose not to raise interest rates in order to eliminate excess demand, resulting in the possibility of credit rationing. Higher interest rates tend to change the behavior of borrowers because they decrease the return on the project but increase payoffs, even if the project succeeds, resulting in moral hazards. In that sense, SBA loan guarantees may alleviate the adverse selection problem by providing lower interest rates, which in turn increase the share of safer borrowers, thus increasing the lender’s expected return and reducing expected losses when borrowers default on loan repayments (Craig et al., 2009; Kwon & Lee, 2016). Additionally, to the extent that SBA loans guarantee lower interest rates, they help mitigate the moral hazard problem by making the loans more affordable and thus reducing the likelihood of defaults (Craig et al., 2009). The existence of credit rationing in small business credit markets therefore justifies the existence of government-sponsored programs aimed at improving small businesses access to credit.
In a similar vein, there is substantial literature on discriminatory lending practices, particularly those based on racial and geographic characteristics (Bates et al., 2011, 2018; Bates & Robb, 2014; Immergluck, 2002). These studies contended that minority business owners are more likely to be turned down for a loan than white business owners, and banks tend to give smaller loans to businesses located in certain communities. One line of research provided a theory of race-based discrimination using the concept of cultural proximity (Aaronson et al., 2004; Fisman et al., 2017). The theory emphasizes the importance of shared codes, languages, religions, and/or cultures between potential transactional parties. In particular, the theory describes how commonalities in ethnic origin increase the likelihood that a transaction will take place and its outcome. Due to this cultural proximity, lenders, who are predominately white, may be reluctant to provide loans to minority business owners. On the other hand, Lang and Nakamura (1993) provide a theory of redlining based on incomplete information, explaining that there is a higher loan denial rate in lower-income areas because lenders receive few applications from lower-income neighborhoods, and they have little information about how to evaluate applications from these areas. Such redlining and discrimination based on race also justifies the government-guaranteed loan programs in that SBA lending aims to provide loans to small businesses that might not otherwise be able to obtain financing with reasonable terms and conditions.
Economic Impacts of Small Business Administration Programs
As discussed, the primary goal of SBA lending programs is to mitigate market incompleteness by improving entrepreneurs’ access to credit and to promote local economic growth by helping establish viable small businesses. It is therefore reasonable to expect that if SBA lending programs have performed as planned, there should a positive relationship between the programs and economic growth. However, research on the impacts of small business lending on local economic growth paints a mixed picture (Cortes, 2010; Craig et al., 2007, 2008, 2009; Doctors & Wokutch, 1979; Y. S. Lee, 2018; Rupasingha et al., 2019). Some studies assert that SBA-guaranteed lending programs yield positive social benefits, such as per capita income and employment growth at a local market level (Brown & Earle, 2017; Cortes, 2010; Craig et al., 2007, 2008). Conversely, others argue that these programs have minimal effects on income or employment in the areas that receive these loans (De Rugy, 2007; Higgins et al., 2021; Y. S. Lee, 2018; Rupasingha et al., 2019).
While previous research has made significant contributions to our understanding of the economic effects of SBA loans, the existing literature has some limitations. First, prior studies have often considered SBA loans as a homogeneous group, overlooking the potential for differing effects depending on the specific loan program. Notably, the SBA’s 7(a) and 504 programs serve different purposes and have distinct characteristics. The 7(a) program aims to help small businesses that cannot secure bank credit on reasonable terms and lack other financing sources. In contrast, the 504 program aims to promote economic development by facilitating job creation and retention. Given these differing aims, it is reasonable to expect that the economic effects of these programs might vary. However, most previous studies have estimated the aggregate effects of SBA programs rather than separately estimating the effects of each program.
Second, the literature has largely focused on examining the effects of SBA loans during the 1990s and 2000s, even in recent research. This limitation is significant because the economic conditions in communities have changed rapidly over the past several decades. For instance, the economic recession in 2007-2009 followed by the COVID-19 pandemic in 2020 had a profound impact on small businesses and may have altered the lending landscape and the effects of SBA loans. Therefore, there is a need for updated analysis that reflects more recent economic conditions.
Third, although some studies have examined the effects of SBA lending by community characteristics, the scope has been limited to a low–high-income continuum. There is little research on whether SBA lending has had a greater impact on counties with lower-income communities or a higher proportion of minority populations. Given the historical and ongoing racial and ethnic disparities in access to credit, it is crucial to understand whether SBA loans have been effective in promoting economic development in these communities.
To address these gaps in the literature, the current study aims to provide a more nuanced understanding of the economic effects of SBA loans. Specifically, this study investigates whether counties with a greater volume of small business loans had higher levels of employment between 2010 and 2016. In addition, by separately estimating the effects of SBA loans by program, this study tests whether counties with a greater volume of SBA 504 loans had better economic outcomes during this period. This study also examines whether SBA lending has had a greater impact on counties with lower-income communities or a higher proportion of minority populations, particularly blacks and Hispanics. Furthermore, since low-income and minority communities often intersect, leading to compounded or double discrimination, this study further examines the employment effects of SBA loans on low-income minority communities. By addressing these research questions, this study contributes to our understanding of the economic impacts of SBA loans and can inform policy interventions to promote small business development and economic growth.
HYPOTHESES
Based on the objectives of the SBA loan programs and the existing literature, this study proposes the following hypotheses:
Hypothesis 1: Counties with a greater volume of SBA loans will exhibit higher employment levels. This hypothesis stems from the assumption that SBA loan programs, by providing support to small businesses, enable these entities to expand their operations, thus contributing to unemployment reduction.
Hypothesis 2: The positive employment effects of SBA loans will be more pronounced in low-income minority communities. This hypothesis draws on the understanding that low-income and minority communities frequently overlap, resulting in a compounded or double-discrimination effect. The infusion of SBA loans could therefore have a pronounced positive impact on promoting employment within these communities.
Hypothesis 3: The economic effects of SBA loans will differ based on the specific loan program. Given the distinct objectives and features of the 7(a) and 504 programs, it is logical to anticipate variations in their respective economic impacts.
Testing of these hypotheses will be further elaborated in the “Estimation Model” section of this study.
DATA AND METHODOLOGY
Data
The data on SBA-guaranteed 7(a) and 504 loans obtained from the SBA included borrower and lender information on all SBA-guaranteed 7(a) and 504 loans from 2010 to 2016, while the data on socioeconomic conditions were derived from various sources, including the U.S. Decennial Census, American Community Survey, County Business Pattern, and Federal Deposit Insurance Corporation. Detailed descriptions of all the variables are presented in Table 1.
Estimation Model
The empirical analyses conducted in this study estimate the effects of SBA lending on employment, using county panel data spanning seven years, from 2010 to 2016. Some prior studies have utilized fixed-effect estimation, which necessitates a strict exogeneity assumption to control for time-constant unobserved heterogeneity (Cortes, 2010; Craig et al., 2007). However, this strict exogeneity assumption may not hold when the dependent variable— in this case, the annual employment rate— is observed over time and its value partially depends on its values from previous periods (Wooldridge, 2013).
Also, while the Generalized Method of Moments (GMM) may be a viable estimation option—particularly if the previous year’s SBA loans potentially influence the current year’s lending activities—this study opted for a first-difference estimation. This choice was driven by the study’s careful consideration of its specific data structure and the endogeneity issue at hand. The first-difference estimation method assumes a considerably weaker exogeneity, allowing for the future values of the regressors to correlate with the error term. This method is more appropriate under these circumstances. This estimation strategy yields the following reduced-form estimation model:
ΔEmpi,t=ΔSBAi,t−1β1+ΔLMIi,t−1β2+ΔBlacki,t−1β3+ΔHispanici,t−1β4+ΔXi,t−1γ+Δμt+Δεit
In Equation (1), is the annual employment rate for county at time The primary variable of interest on the right side of the equation is which is the lagged SBA loans, measured as the number of loans per 1,000 businesses. Moreover, the variable SBA loans is categorized into two groups—7(a) loans and 504 loans—to determine whether the effects of SBA loans on local employment vary based on the type of SBA program. equals one if the median household income in a county is less than 80% of the national median household income; otherwise, it is zero. The 80% cutoff corresponds to the definition of LMI geographies by the U.S. Census Bureau and the U.S. Department of Housing and Urban Development. represents the proportion of the black population in a county, and represents the proportion of the Hispanic population in a county. A series of a county’s economic characteristics are included in as the set of lagged control variables. Based on prior literature, this study included population size, the proportion of the population with a bachelor’s degree or higher, the number of small businesses, and the proportion of small businesses with 20 employees or less to measure each county’s basic demographic and economic profile (J. Lee, 2015). The variables of location quotient for manufacturers, retailers, wholesalers, and services are included to measure how concentrated a particular industry was in a county compared to the national average because local industrial composition is an important determinant of local employment (Cortes, 2010; Ramsey, 2018). The commercial banks’ deposits in a county are used to measure the competitiveness of the local banking market.
I then extend the analysis by estimating Equation (2) to determine whether SBA lending has a larger impact on counties with lower- and moderate-incomes (LMI). As discussed earlier, for small businesses, LMI black or Hispanic counties may be more vulnerable locations in terms of securing bank credit than upper- or middle-income white counties because they are often discriminated against twice: first, because of their minority status, and second, because of geography (i.e., redlining) (Bates, 2010; Bates et al., 2018; Bates & Robb, 2016; Immergluck, 2002; Immergluck & Mullen, 1998). As previously noted, if an SBA lending program alleviates market failure such as credit rationing, adverse selection, or moral hazard (Stiglitz & Weiss, 1981), then SBA lending will have a greater impact on LMI black or Hispanic counties. This study therefore also assesses whether the positive effects of SBA lending programs were greater in LMI minority counties, particularly those where the proportion of the black or Hispanic population was higher:
ΔEmpi,t=ΔSBAi,t−1β1+δLMIi,t−1β2+ΔBlacki,t−1β3+ΔHispanici,t−1β4+ΔSBA×LMIi,t−1β5+ΔSBA×LMI×Blacki,t−1β6+ΔSBA×LMI×Hispanici,t−1β7+ΔXi,t−1γ+Δμt+Δεit
where the variable is an interaction term that is equal to SBA lending times, and the dummy variables indicate the LMI counties. A positive and significant coefficient of indicates that SBA lending has a larger impact in LMI counties. The variable is an interaction term that is equal to SBA lending times the LMI dummy variable and the proportion of the black population in a county. The variable indicates an interaction term that is equal to SBA lending times LMI dummy variable and the proportion of Hispanic population in a county. A positive and significant coefficient of or suggests that SBA lending has a larger impact in LMI counties with a higher proportion of black or Hispanic populations.
The Instrumental Variable and Two-stage Least Squares Estimates
The variable SBA may be influenced by local characteristics that are also associated with employment growth, and therefore endogeneity may be a concern when estimating the effects of SBA on employment (Cortes, 2010; Craig et al., 2007, 2008; Y. S. Lee, 2018). To address potential endogeneity in this study, this study uses the first-difference estimator to control for time-invariant characteristics that may have affected the outcome variables. The lagged variables are also used because past SBA loans may be more responsible for present employment than present levels of SBA loans (Rupasingha & Wang, 2017). However, these strategies may not be sufficient to rule out a risk of endogeneity. For instance, the estimated effects of SBA loans on employment may be biased upward if prosperous counties see higher levels of entrepreneurial activity and more SBA loans. Conversely, if struggling counties see higher levels of SBA loans, then the estimated effects may be biased downward. Additionally, if the lagged SBA loans are correlated with the current SBA loans, a relationship between current employment and the lagged SBA lending activity cannot be completely ruled out. Therefore, to further alleviate the endogeneity, this study uses a first-differenced two-stage least squares (2SLS) specification with years since interstate banking deregulation as the instrumental variable (Y. S. Lee, 2018).
Banks in the U.S. were prohibited from establishing branches across state borders until the 1970s, and only decades have passed since states started to permit interstate banking, which allows banks to own and operate branches in more than one state (Davis & Katchova, 2020). This deregulation has provided more opportunities for commercial lending (Kroszner & Strahan, 1999). The areas that deregulated banking earlier therefore have more options for commercial lending, and this in turn could reduce the need to go through the bureaucracy of the SBA to secure government-guaranteed loans (Y. S. Lee, 2018).
RESULTS
Descriptive Statistics
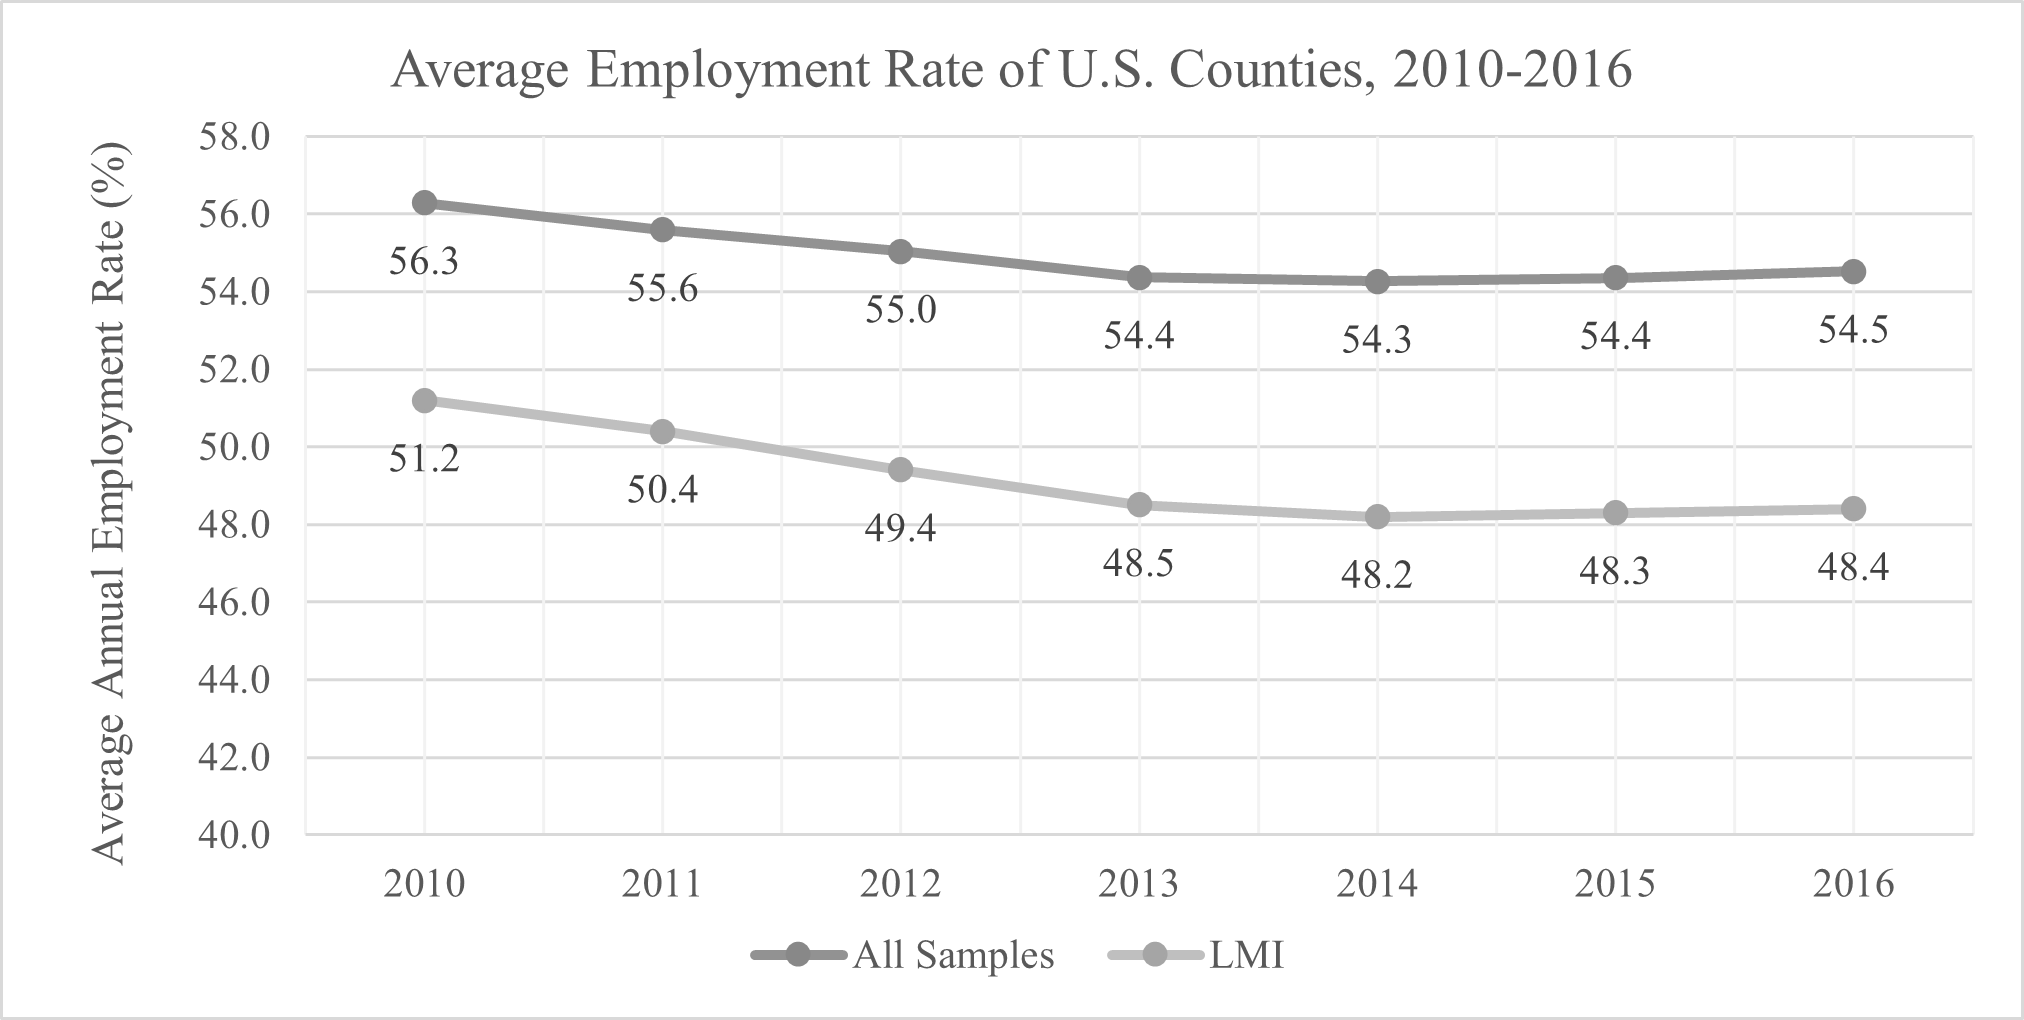
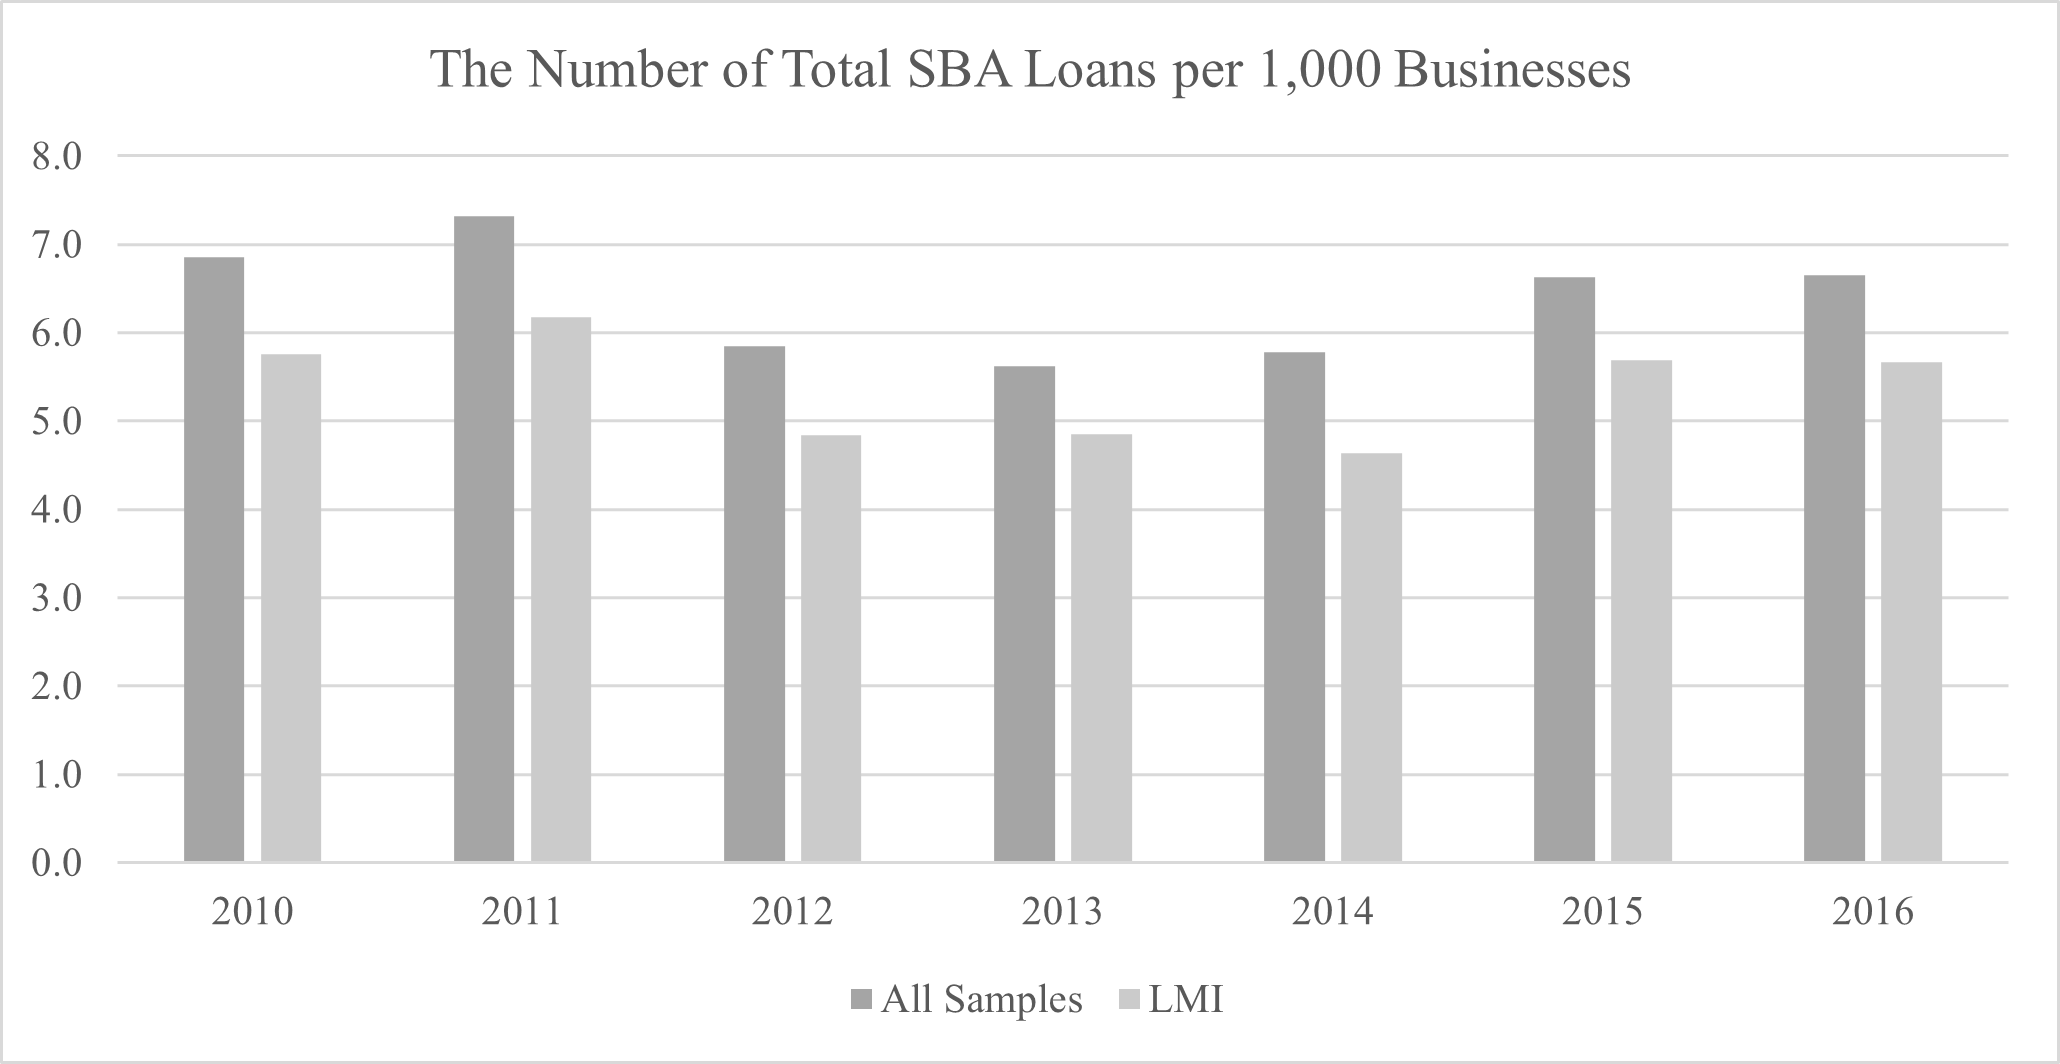
Table 2 presents the descriptive statistics for all the variables used in the study. The first column indicates the full sample, and the second and third columns represent the 2010 and 2016 samples, respectively. The last column shows the change in each variable between 2010 and 2016. Figures 1 and 2 illustrate the trend in annual employment and the size of the SBA programs for all and LMI counties, respectively. The average employment rate in U.S. counties declined continuously from 56.3 percent in 2010 to 54.3 percent in 2014 but has shown signs of recovery since 2015. Despite a resilient economy in recent years, the employment rate of 54.5 percent in 2016 did not reach the 2010 level. As Figure 1 shows, LMI counties followed the national trends overall. However, their employment rates were much lower than the national average. The average employment rates for LMI counties were 51.2 percent in 2010 and 48.4 percent in 2016, a decrease of 2.8 percentage points. Table 2 also shows that the total number of SBA loans decreased from 6.86 to 6.65 per 1,000 businesses between 2010 and 2016. As shown in Figure 2, the SBA lending activity for LMI counties was lower than all counties.


Table 2 also shows the descriptive statistics for the other control variables. Between 2010 and 2016, the average proportion of LMI counties in the U.S. was 44 percent. Over the same period, the proportions of black and Hispanic populations increased slightly. In 2016, counties had, on average, 110 more small businesses than in 2010. However, the proportion of small businesses with 20 employees or less decreased slightly from 90 percent in 2010 to 89 percent in 2016.
Empirical Results
Table 3 presents the results of the effects of an increase in the number of SBA loans on employment, and Table 4 indicates the results of the SBA 7(a) in columns (1) and (2), and that of the 504 programs in columns (3) and (4). As shown, the coefficients of the instrumental variable of years since interstate banking deregulation were negative and significant across all the models, suggesting that small businesses are less likely to go through the bureaucracy required to secure SBA loans if they have other commercial lending options. Furthermore, the F-values for the first stage pass the rule of thumb F > 10 very well, indicating that the IV is strong enough in terms of predictive power. All the models shared control variables that measured the counties’ socioeconomic characteristics, and the year-fixed effects were included. The results of the total SBA loans were similar to those for the SBA 7(a) loans because the number of SBA 7(a) loans accounted for nearly 90% of the total SBA loans over the study period. When discussing the results, this study therefore focused on SBA 7(a) and 504 loans.
The results of the IV analysis indicate that the estimated coefficients of the SBA loans were negative and statistically significant. This implies that an increase in SBA loans, particularly 7(a) loans, in non-LMI counties, was negatively associated with employment. While there may be various reasons for the association of a decrease in employment with an increase in SBA loans, capital–labor substitution is one possible mechanism behind these findings (Higgins et al., 2021). In other words, if capital and labor are substitutes, small businesses that can substitute capital for labor may increase their capital and lower employment. Notwithstanding, even if small businesses that receive SBA loans expand their businesses and increase employment, the aggregate employment effect at a county level may be attenuated or even negative if there are negative spillover effects on competing small businesses (Brown & Earle, 2017). It is also possible that SBA loans may crowd out commercial lending. If so, there would be little capital addition in the area. In that case, even if SBA loans have positive effects on employment, these effects may be attenuated or turn out to be negative at a county aggregate level.
This study finds some evidence that employment growth was negatively associated with LMI, black, and Hispanic counties, which is not surprising because lower employment has been an issue in these communities for a long time. For example, column 2 in Table 4 shows that the employment rate for LMI counties was 0.4 percentage points lower than that for non-LMI counties. However, the positive and significant coefficient of SBA7a × LMI indicates that SBA 7(a) loans had a positive effect on employment in LMI counties, with one increase in SBA 7(a) loans per 1,000 businesses increasing the employment rate by 0.09 percentage points. The difference in employment rates between LMI and non-LMI counties was therefore narrowed down to 0.31 percentage points. The results also reveal that LMI counties where the proportion of the black population was higher had an additional employment gain of 0.02 percentage points. These findings are consistent with the credit-rationing argument that less developed financial markets, such as minority-concentrated neighborhoods, receive relatively higher benefits as a result of governmental interventions in small business credit markets (Stiglitz & Weiss, 1981).
Nevertheless, the results of the effects of SBA 504 loans on employment were somewhat different from those of SBA 7(a) loans. While the employment effects of SBA 7(a) loans were negative in non-LMI counties, columns 3 and 4 in Table 4 demonstrate that the employment rate increased by 0.25–0.26 percentage points with one increase in the number of SBA 504 loans per 1,000 businesses in these counties. Furthermore, column 4 in Table 4 shows that the employment rate in LMI counties was 0.18 percentage points lower than that in non-LMI counties, but SBA loans reduced the gap by increasing the employment rate by 0.24 percentage points for every 504 loan per 1,000 businesses in LMI counties. The positive employment effects of the SBA 504 loan program may be due to its emphasis on community development through employment. Indeed, the 504 program requires small businesses that use 504 funds to create or retain at least one job for every $65,000 guaranteed by the SBA. However, the results indicate that the SBA 504 loans did not have an additional employment effect in LMI black or Hispanic counties.
DISCUSSION AND CONCLUSION
There is a general consensus that gaps exist with respect to access to financial capital for small businesses in different communities. In particular, small businesses in lower-income communities and/or those with a higher proportion of minorities are more likely to face credit rationing in the financial market, which justifies the existence of government-guaranteed lending programs such as SBA loans. Accordingly, using data from the SBA’s small business lending programs and the seven-year county panels from 2010 to 2016, this study tests whether SBA lending had a larger impact on counties with lower incomes and/or where the proportion of the black or Hispanic population was higher.
Overall, this study finds that an increase in SBA loans had a positive effect on employment in underserved communities, which suggests that capital and labor are gross complements rather than substitutes. However, when examining the effects of SBA lending by program and counties’ race and income demographics, there is some heterogeneity across counties. Specifically, the effects of an increase in SBA 7(a) loans are negative for non-LMI counties but positive for LMI counties, particularly where the proportion of the black population is higher. There is no effect on LMI counties where the proportion of the Hispanic population was higher. However, unlike with SBA 7(a) loans, an increase in SBA 504 loans has a positive effect on employment in both LMI and non-LMI counties although the findings show no additional employment gains from SBA loans in LMI counties where the proportion of the black or Hispanic population was higher.
This study also investigates whether counties with a greater volume of SBA 504 loans, which place emphasis on employment growth and job retention, experience better economic outcomes. The analysis indicates that there were larger employment effects as a result of SBA 504 loans than SBA 7(a) loans. For example, in LMI counties, the employment rate increased by 0.24 percentage points for every 504 loan per 1,000 businesses and by 0.09 percentage points for every 7(a) loan per 1,000 businesses. Moreover, a $1,000 increase in SBA 504 loan value per business increased employment rates by 0.36 percentage points, while the same value increase in SBA 7(a) loans increased the employment rate by 0.27 percentage points in LMI counties. Given that SBA 504 loans are used to finance commercial real estate and large equipment, and SBA 7(a) loans are intended to finance working capital, from a policy perspective, the findings indicate that loans for larger items such as machinery and plants are more likely to influence employment.
This study contributes to the literature by (1) adding more community characteristic dimensions such as race, (2) providing a richer assessment of SBA lending by separately estimating the effects of SBA loans by program, and (3) updating the previous results in the literature that focused on the 1990s and 2000s. However, the results presented herein should be interpreted with some caution due to several limitations. First, this study reveals that the responses of communities to capital inflow were heterogeneous but did not test the mechanism underlying these findings. For example, why does the SBA 7(a) program have a positive effect on LMI counties but not non-LMI counties? Why does the SBA 504 program have a positive effect on employment for both LMI and non-LMI counties? Moreover, why do LMI black counties see positive impacts but LMI Hispanic counties do not? The answers to these questions remain unknown or are inconclusive although they are important for policymakers to better design guaranteed loan policies. Future research should therefore aim to provide more insights into this issue by examining the mechanisms underlying the different community responses to SBA loans. Also, this study did not investigate the effects of SBA loans by industry. This was primarily due to data constraints and the difficulty with constructing a balanced region–industry-level SBA loan panel. However, the impact of SBA loans on employment could differ by industry. It would therefore be valuable to identify which industries derive greater benefit from SBA loans and thus contribute to local economic growth. Lastly, given the specific scope and constraints of this research, conducting robustness checks with varying scenarios was beyond the scope of this study. As a result, the findings presented here should be interpreted with caution. I recognize that a more comprehensive assessment of robustness would enhance the credibility of the findings. This also leaves open an opportunity for future research to further evaluate the effects of SBA loans under different conditions or assumptions, hence expanding upon the findings of this study. I hope this study offers a clearer understanding of the effects of SBA programs on different communities and assists policy makers in tailoring SBA programs based on communities’ characteristics.