INTRODUCTION
The mechanisms and procedures to achieve the 17 Sustainable Development Goals (SDGs) of the UN Agenda 2030 have become a significant policy topic within emerging market and developing economies (Barbier & Burgess, 2023). Government interventions in form of price subsidies is one of the major policies that have direct impacts on natural resource consumption and depletion of non-renewable resources. A subsidy, in the context of government assistance, encompasses various forms of financial contributions, income support, or price support aimed at benefiting the recipient. Specifically, a price subsidy refers to a form of subsidy that causes a deviation of actual prices faced by consumers and producers from a benchmark level. These subsidy programs exhibit diverse forms and categories, including financial transfers to producers or consumers, providing goods or services at reduced or no cost, and regulatory policies facilitating transfers between different groups (WTO, 2006). Price subsidies are employed to influence consumption and production patterns, as well as resource distribution (International Monetary Fund, 2008).
Besides, subsidies are designed to benefit recipients by overcoming international price fluctuations, promoting trade, increasing industrial development, and improving household welfare (Jeong, 2023). The responsiveness of demand to price changes is a critical input for evaluating policies aimed at reforming subsidies and appreciating the trade-offs between the economic, environmental, and social impacts of such policies (Ellis, 2010).
However, many studies prove that subsidy programmes are inefficient and fail to meet their objectives (Commander, 2012; Couharde & Mouhoud, 2020; Min Soo et al., 2011; Zarepour & Wagner, 2022). Paying subsidy for goods encourages unsustainable consumption patterns in land, fossil-fuels, water and other natural resources (Coady et al., 2017), which also results in heavy government financial burden, smuggling and fraud (Ghoddusi et al., 2022), as well as creating corruption problems (Akanle et al., 2014). Empirical studies show significant social costs of subsidies, and a causal relationship exists between subsidies and public social spending.[1]
Applying any form of subsidy removal policy would not only generate government revenues, but also reduce the inefficient use of natural resources and in turn would reduce pollutions and externalities. In general terms, there is evidence of the mixed relationship between economic, social, and natural resource issues. Empirical findings of relationship between subsidy removal and economic variables, environment and changes in consumption and production patterns are based on conditions that under business-as-usual scenarios, the economy reached to an equilibrium which there is no inefficient resource allocation, even with the presence of subsidy. In fact, it is not only assumed that all markets find their equilibrium with subsidy but also that nothing happens until new equilibrium is reached after subsidy removal. As the inputs, models and outcomes from these assumptions are very important for policy decision, the empirical findings from the literature are described in the following sections.
Removing subsidy issue is especially important for setting goals and developing policies in areas such as natural resource sustainability (land, non-renewable fuels, water resources), environmental economics (air and water pollutions), public economics (subsidy distribution), public finance (fiscal budget deficit) and urban economics (congestion and traffic). However, there are active debates on removing subsidies to reduce the adverse impacts. There are many concerns for the government to phase out subsidies. One main concern is that higher prices caused by subsidy reform would negatively affect household welfare, especially for vulnerable low-income households, which may push them below the poverty line (Coxhead & Grainger, 2018; Jewell et al., 2018). Furthermore, public resistance occurred when some countries attempted to reform the existing subsidy policies (Gutner, 2002). Another reason is that subsidy removal policy normally creates political pressure on the government, as the reform may result in losing public political support for their party. Therefore, understanding the impacts of subsidy removal is of great significance. To do this, a comprehensive literature review is needed to identify literature and modelling gaps properly.
Although, there are large volumes of literature on the impacts of subsidy removal, only Couharde and Mouhoud (2020) reviewed the income-distributional effects and poverty impact of fossil fuel subsidy reforms. Insufficient reviews prevent a comprehensive understanding of the impacts of subsidy removal. To address these gaps, the present review makes two significant contributions: 1) developing a systematic literature review on the impacts of subsidy removal; 2) identifying the products, countries studied, impact distributions, and policy suggestion distributions. It highlights impacts that have received limited exploration or are subject to contention, thereby providing scope for future research. The rest of the paper is organized as follows: Section 2 describes the research design and methodology, Section 3 discusses the results, and Section 4 provides the conclusion.
RESEARCH DESIGN AND METHODOLOGY
This research sought a complete overview of the subsidy removal policy. For achieving this objective, this study proceeds with both quality and quantity analysis of the literature. It will follow an updated guidance of a Systematic Literature Review (SLR) to investigate the issues and challenges of subsidy removal agenda.
Search Strategy and Information Sources
This research adopted the Preferred Reporting Items for Systematic reviews and Meta Analyses (PRISMA) statement (Page et al., 2021). It allowed us to describe the review procedure and to define the boundaries of what is known and what is not known by a replicable, scientific, and transparent process. This minimises the bias and omissions and improves the reliability and accuracy of conclusions by providing explicit study guidelines for the reviewers (e.g. keywords, specific research questions, limitations and exclusions criteria, eligibility, etc.) (Cook et al., 1997; Mulrow, 1994; Tranfield et al., 2003).
Formulation of Research Questions
Following Tranfield et al. (2003) and Liberati et al. (2009), the PRISMA protocol used in this research is composed of three main stages: identification, screening, and eligibility. Before processing the above stages, the importance of the review questions is defined, and an explicit statement of the questions being addressed have been provided. This research is trying to answer the question: What are the impacts if governments remove price subsidies? Do price subsidy removal schemes necessarily lead to economic distortions? We utilised Web of Science and Scopus to search the published articles for systematic reviews, with the search string relating to the main keywords “impacts” and “subsidy removal” in their titles, abstracts and keywords.
Systematic Searching Strategy
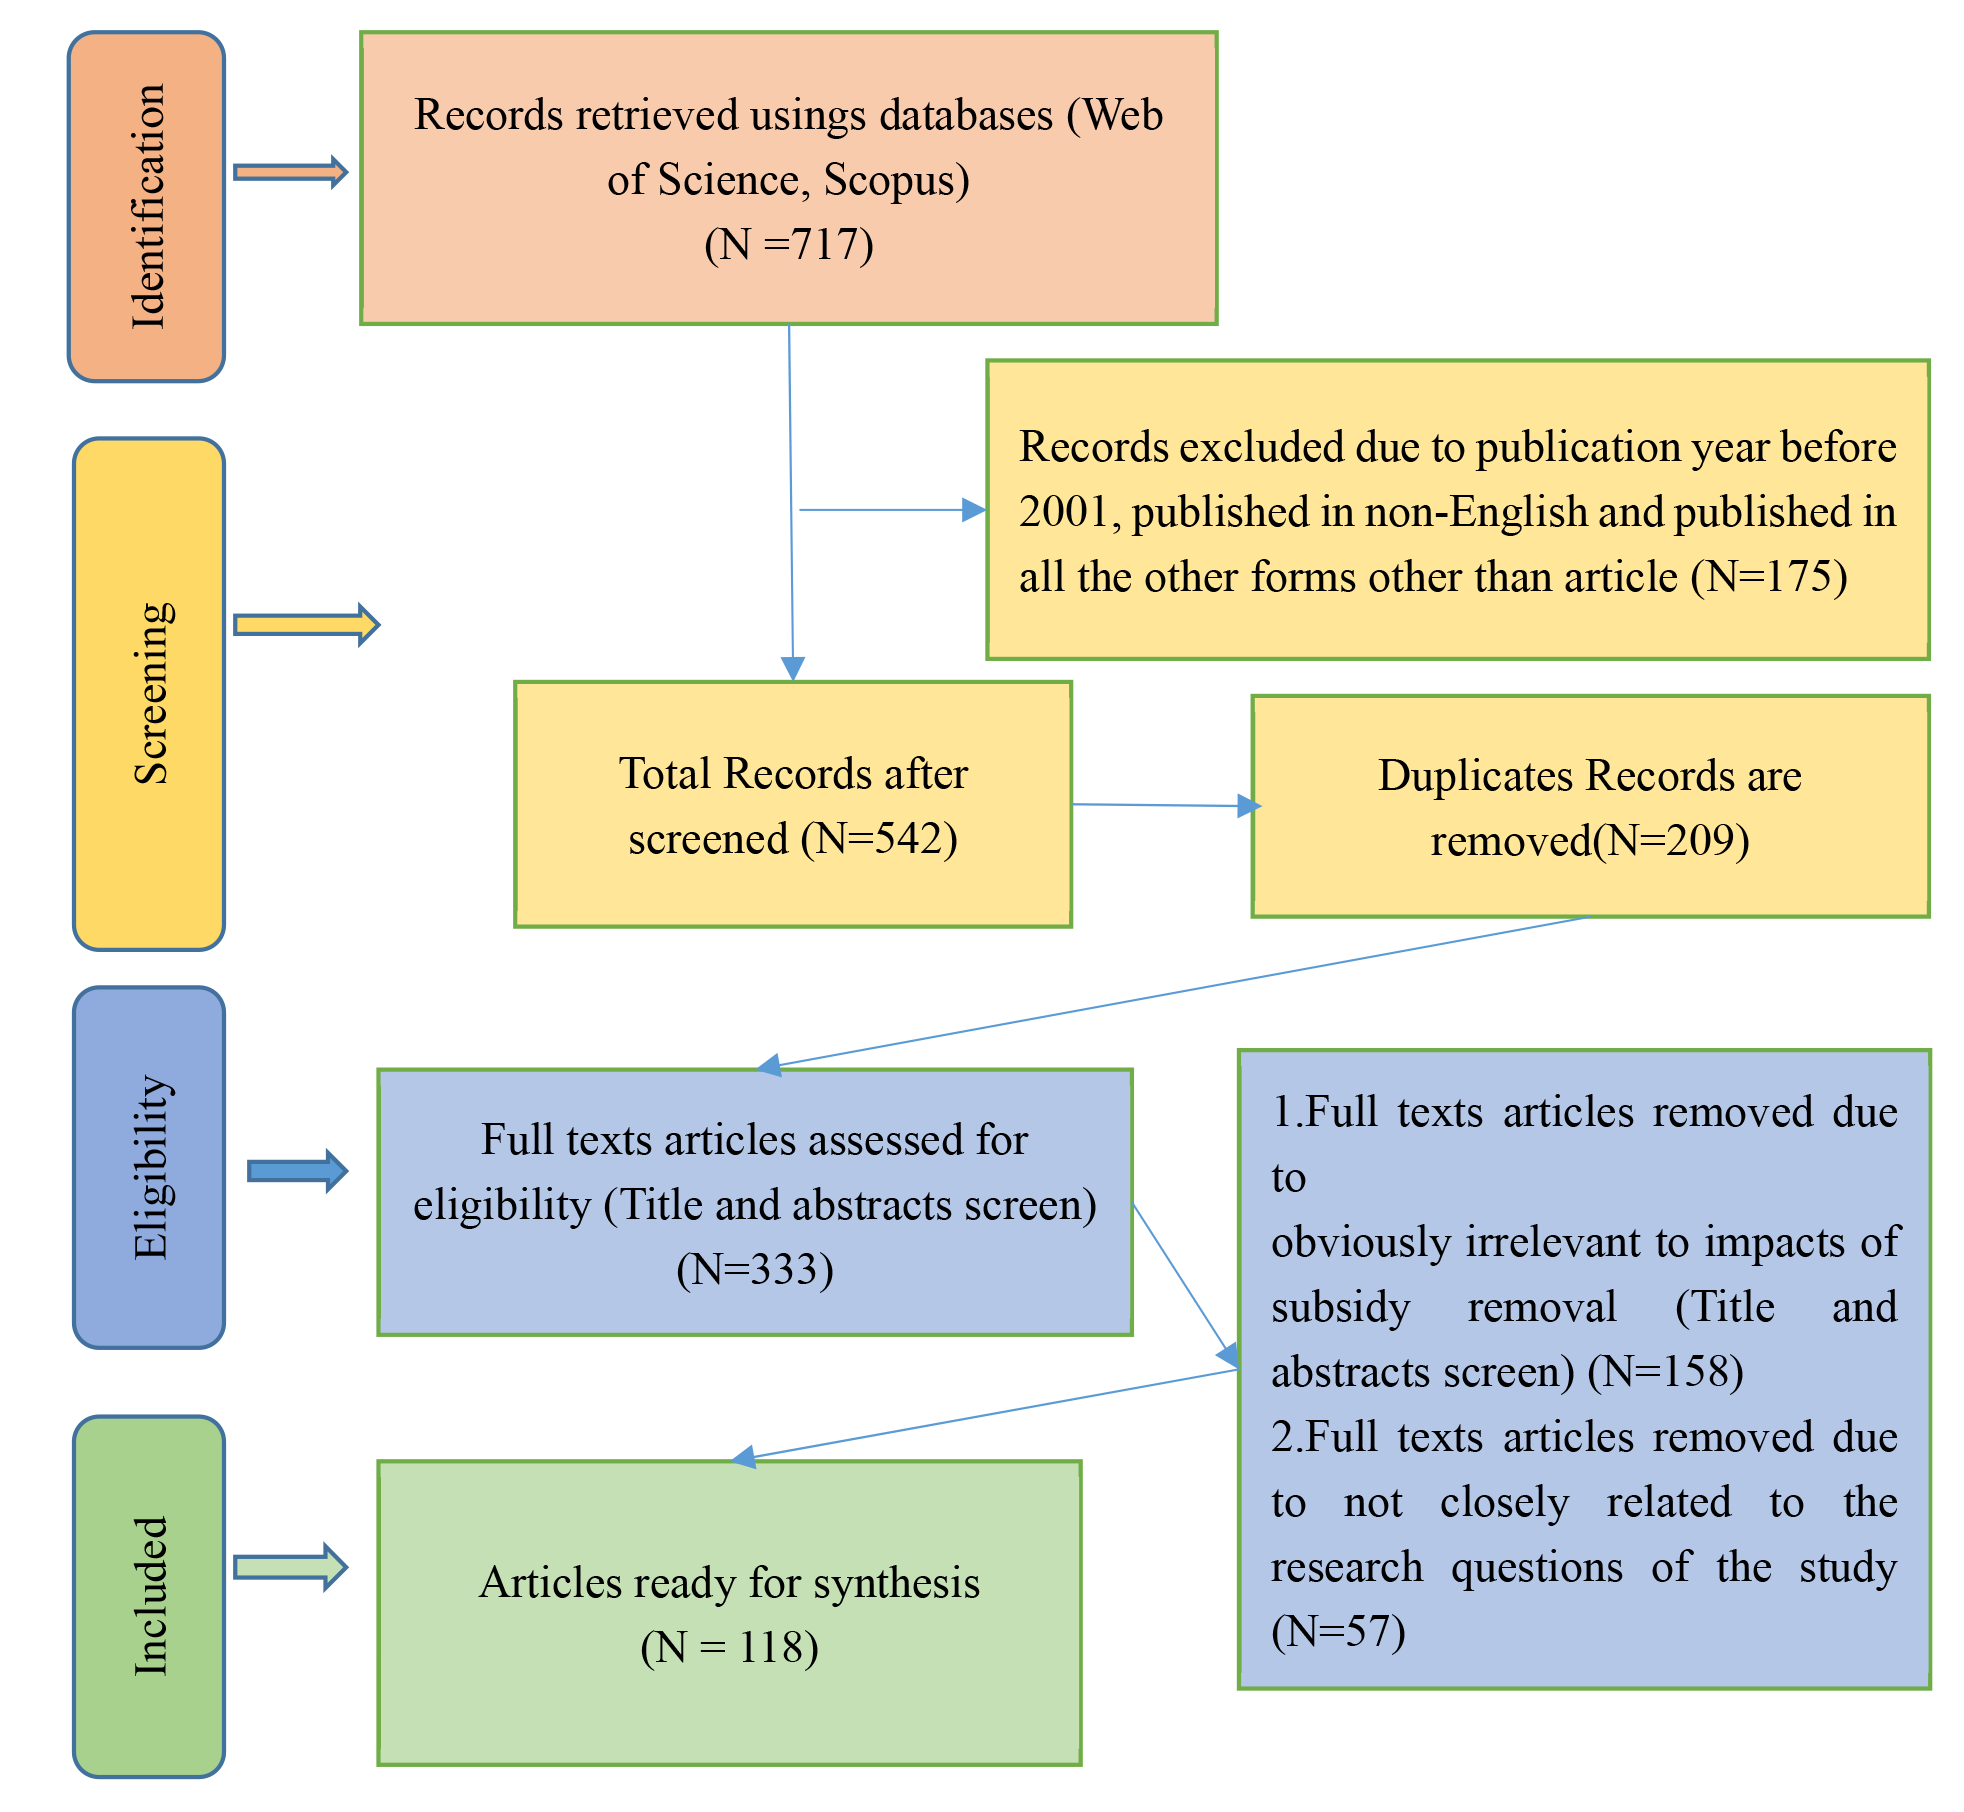
The systematic review proceeds with identification, screening (limitation and exclusion criteria), and eligibility to select the included articles. Figure 1 illustrates the searching strategy designed and applied in this research.

Identification
After confirming the main keywords for the systematic literature review (i.e., “impact” and “subsidy removal”), the synonyms, related terms, and variations of the keywords are explored with no omission, which will help identify more related articles from the selected database. These keywords will be organised into full search string based on the Boolean operator or field code functions that meet the criteria of the target databases. This review will choose the two main databases, Web of Science (WOS) and Scopus, not including Google Scholar, for the following three reasons. Firstly, they have the functionality of an advanced search engine, which is necessary for systematic reviews to retrieve articles more efficiently (Gusenbauer & Haddaway, 2020). Secondly, the articles indexed by these two databases were considered more comprehensive and of higher quality. Last but not least, most citations found only by google scholar tended to be much less cited than citing sources in Scopus or WOS (Gusenbauer & Haddaway, 2020; Martín-martín et al., 2018). The search string will also be developed based on their formulating rules. Table 1 shows the search string in WOS and Scopus. Meanwhile, an advanced indexing search is applied. The total number of articles retrieved on WOS and Scopus with the search string is 717 articles.
Screening and Selection Criteria
As one of the very important step during a systematic literature review, following Okoli (2015), screening stage has been conducted. Accordingly, papers with incomplete information have been excluded (Kitchenham & Charters, 2007). The selection criteria included language, journal, authors, setting, participants or subjects, research design, sampling method, and publication date. According to Kitchenham and Charters (2007) and Higgins et al. (2019), it is necessary to ensure that the criteria can be reliably interpreted and classify studies correctly, avoiding unnecessary exclusions. Table 2 presents the criteria for the current research.
Only articles published in journals and in English between 2001 and 2022 were included in the review, as the studies on impact of subsidy removal multiplied from 2001. For this step, the articles are filtered by the “refine result” function on WOS and Scopus. Therefore, we can limit the (publication) year from “2001 to 2022”, document type(s) to “Article”, and language(s) to “English”. Limiting articles to English in the review was to avoid confusion. Limiting document types to journal articles ensures the review’s quality. During this process, 65 articles from WOS and 110 articles from Scopus were excluded from further examination. Then, all the other 542 retrieved articles were exported to an Excel spreadsheet with the authors’ names, title, abstract, keywords, publishers, and year of publication. We merged the exported results in one Excel spreadsheet or reference management software and then identified and removed the duplicate records (i.e., records reporting the same title, authors, publication year) by their duplicates removing function. A total of 209 articles were removed. After this screening process, 333 full texts articles will be assessed during the following eligibility step.
Eligibility
At the stage of eligibility, all the selected articles were reviewed by authors to clarify whether they are appropriate to be included for further information. After reading the title and abstracts, 158 full-text articles were removed due to irrelevant issue, and 57 of the remaining 175 articles were excluded after reading through the full text. Finally, 118 articles were included after the eligibility process. As the articles indexed by WOS and Scopus were considered to be of relatively comprehensive and higher quality (Gusenbauer & Haddaway, 2020; Martín-martín et al., 2018), all the remaining 118 articles were eligible for the review after the authors assessed the individual studies.
RESULTS
The 118 articles included in this literature review are reviewed to identify the subjects studied and impacts of subsidy removal.
Subjects
Table 3 shows that the impacts of subsidy removal on energy are the leading research stream, occupying 78.81% of the studies. Besides energy, scholars also explored subsidy reforms on agricultural planting, food, cooking oil, dental care, cotton, etc. There are also studies on subsidy removal in certain industries or sectors, such as Small and Medium Enterprises (SMEs), the fishery industry, imports and exports, and credit for agricultural irrigation farmers and exporting firms. One important reason is that detailed information on energy subsidies and subsidy removals is more accessible, because some international organisations, such as International Monetary Fund (IMF) or International Energy Agency (IEA), and some national oil companies publish the data or policies publicly. In contrast, the information on subsidies and subsidy removal on other products is often not implicit and less transparent in most cases (Couharde & Mouhoud, 2020). It is worth mentioning that the less explored impacts of subsidy removal on other scopes deserve more attention for future research.
Analysis of Distribution Characteristics of Major Research Countries/ Geographic regions
The publication of papers on different countries or regions can reflect the importance and influence of subsidy removal to some extent. A total of 27 countries and eight regions were studied by the included papers between 2001 and 2022. As can be seen from Tables 4, among the 27 countries studied, there are 16 Asian countries (Malaysia, Iran, China, India, Indonesia, Kuwait, Saudi Arabia, Thailand, etc.), five African countries (Nigeria, Ghana, Egypt, Ethiopia, and Mali), four European countries (United Kingdom, Finland, Romania, and Ukraine) and two American countries (Mexico and Canada). The countries with the highest number of documents in descending sequence are Malaysia, Iran, China, India, and Indonesia, which are all Asian developing countries and account for 57.27% of the total research on different countries. Malaysia and Iran are the top two countries in article numbers, far exceeding those of other countries, accounting for 16.36% and 14.55% of the 32 countries, respectively.
Table 5 reports a list of regions according to their numbers of publications, and it shows that the research on developing countries also occupies more seats. There are few studies on developed countries, possibly because subsidies are a significant policy concern for many developing and emerging market economies. Subsidy removal has a greater impact on developing countries, given the higher prevalence of low-income households, SMEs, and stakeholders who require support. These groups are more sensitive and vulnerable to policy changes (Azadeh et al., 2013).
Impact Distributions
The impacts are very heterogeneous and related to all sectors of the economy. Based on the literature, the impacts were classified into four groups: the impacts on the whole economy, consumption (household and government), and production (industry). Some studies estimated the impacts of subsidy removal on more than two sectors simultaneously. The impacts on economy and household indicators are more explored than the influences on government and industry. For each group, the key indicators are summarised in Table 6.
Macroeconomic and Environmental Variables
The subsidy removal leads to hiking price of the goods on which subsidies are being removed. Consequently, Consumer Price Index (CPI) and production costs would also rise (V. Ansari et al., 2014). The magnitude of such changes would ultimately depend on the quantum of subsidy reduction. The economic indicators include prices, economic growth, demand, environment, trade, and efficiency.
Industries would reduce their output for the extra costs of commodity production. If they pass on the higher costs to consumers with higher retailing prices, consumers will reduce their demand for the products, pushing the industries to scale down their output. Meanwhile, household consumption would also decrease for the demand effects of higher prices (Yahoo et al., 2017). Thus, the GDP would usually decline in the short run. However, in the long run, GDP may increase or decrease slightly compared to the short run impacts due to capital movements, investment effects, input substitution, technical development, industry upgrading and so on (Yahoo et al., 2017).
Being an open economy, subsidy removal would also affect trade because of its domestic market changes, such as prices, supply, and demand. In most studies, the exports were adversely affected because the products would be more expensive and less attractive overseas. However, in a few cases, the exports do not change (Kapoor et al., 2017) or show an increase because the greater decline in domestic demand would increase the export supply (Othman & Jafari, 2011). Importers also have different performances in different cases of subsidy removal. When domestic prices rise, and the nominal exchange rate does not fluctuate widely, foreign goods become relatively cheaper for locals, and their import would increase. However, the simulation results of some studies also prove that the import would decrease, even with gradual omissions of subsidies in 5 years (Karami et al., 2012). One reason is that producers can find substitutes for intermediate inputs and primary factors with higher prices. However, for households when such substitutes cannot be found, they would reduce consumption. Then, the import may also decrease (Yahoo et al., 2017)
In terms of economic efficiency, removing subsidies is proven to allocate the budget more efficiently and improve economic development. However, the abolition of energy subsidies also resulted in less efficiency in the short and long run (Preecha & Wianwiwat, 2017). Removing the subsidies is proven to exacerbate the inefficiency of small ruminant production by accentuating feed inadequacy (Al-Khaza’leh, 2020).
As most previous studies explored the impacts of energy subsidy removal, environmental quality is a key concern. With the growing international clamour to reduce carbon emissions, energy subsidy removal is expected to curb wasteful consumption. Some studies simulated the effects of reducing energy subsidies on greenhouse gas emissions and proved that the overall emissions would be reduced, and the environmental quality would be improved. However, some simulation experiment points to evidence that subsidy removal increases the rate of CO2 emissions for the existence of a “green paradox” (Wesseh & Lin, 2016) or rebound effects. Rebound effects of subsidy removal were proved to generate positive externalities to regions without subsidy removal and were harmful to global emission reductions (Lin & Li, 2012).
Household Consumption Pattern
In the micro-economic view, a price increase will consequently reduce consumer surplus, and any gain (loss) of consumer surplus can indicate an increase (decrease) in household welfare in an economy (Husaini et al., 2019). The effects on the welfare of households were estimated in different scenarios. Most results showed that households’ welfare decreases in scenarios without mitigation measures. While some simulations suggest that subsidy cuts will improve household welfare in the longer term (Breisinger et al., 2019) or welfare impact on the household is rather mixed (Dennis, 2016). It is worth mentioning that household dis-aggregation is quite different in the literature. Based on their research objectives, the data sources and a wide range of demographic and socioeconomic characteristics, households are sorted into sample groups by different criteria, such as expenditure, income, locations (urban, rural, or regions), ethnicity, and so on. The impacts of subsidy reform on different households were not evenly distributed (Karami et al., 2012). However, more than 66% of scholars did not dis-aggregate the household in their research.
Subsidy abolishing will lead to adverse impacts on lower-income segments of society, such as shrinkage in households’ real consumption (Karami et al., 2012), which may lead to strong public opposition or protest. Furthermore, the magnitude of the influence depends on the intensity of commodity consumption, geographical location, income and the share of consumption in the household’s income. The empirical studies showed the negative impacts of subsidy reform on household income (or wage). Despite the decrease in labour cost, subsidy removal discourages the incentive to employ for the hiking production cost and reduced profit, and employment will consequently fall (Roos & Adams, 2020). However, positive spillovers from subsidies abolishing the economy, such as higher employment, productivity and profits were identified (Mundaca, 2017), enhancing allocation efficiency and increasing employment.
Government Consumption Pattern
Subsidy reform has been considered a key and complementary solution to improve government revenues and restore fiscal balance (Shehabi, 2020). There has been common consensus on the mentioned effects of subsidy reform on revenue and expenditure (Gharibnavaz & Waschik, 2015; Karami et al., 2012). In general, subsidy removal would have adverse effects on government expenditure and positive effects on revenue. The magnitude of government revenue and expenditure changes varies in the long run compared to the short run. However, one study proved positive government expenditure after subsidy removal because of the model assumption (Gelan, 2018).
In general, investments are savings driven. When subsidies were phased out, the government’s savings increased. The increased savings are usually reallocated by investing in the targeted programmes to avoid poverty reduction setbacks and improve the affected households’ welfare (Breisinger et al., 2012). Some empirical studies also showed an investment decline after subsidy removal in the short term, but investment increases in the long term with the absorbed capital accumulation (Li & Solaymani, 2021; Preecha & Wianwiwat, 2017).
Production Pattern
Producers use primary factors such as capital, labour and land as well as intermediate inputs to produce their outputs. Subsidies for industrial inputs are also heavy burdens to the government and deadweight loss to the economy, which make the recipients over-dependent on the subsidy and result in lower competitiveness and productivity (Khalid & Salman, 2020).
In general, a cut in subsidies to industrial inputs will increase the cost of production. However, a study on cross-subsidies removal found that production cost falls in all sectors (Sandu-Loisel, 2007). The cost increases do not equate with competitiveness losses, which depend on the capacity of the producers to respond to the overall cost shock. Assessing producers’ ability to implement the following response measures, e.g., absorption, substitution, efficiency, and pass-on, can determine to what extent cost increases turn into competitiveness losses (Rentschler et al., 2017). However, most empirical studies show the negative impacts of subsidy reform on competitiveness.
Industrial producers would endeavour to improve their productivity for sustainable development, as they are incentivised to invest in more efficient and productive capital equipment, which will also enhance economic efficiency (Amann et al., 2021; Wang et al., 2022). Meanwhile, the government could also help the industry by reallocating the increased savings from subsidy reform to improve productivity by developing better infrastructure, increasing R&D investments and so on (Narayanan G. & Rungta, 2014).
Overlapping Relationships among the Various Impacts of Price Subsidy Removal
In these studies, some articles only focus on specific indicators or sectors, such as energy consumption (N. Ansari & Seifi, 2012; Azadeh et al., 2013), producers’ welfare (Seyed Nematollah Mousavi, 2012), household welfare (Ilyas et al., 2022), and firms’ competitiveness (Rentschler et al., 2017). However, other studies take a more comprehensive approach to examining the impacts of price subsidy removal from various perspectives. Table 7 illustrates the distribution of overlapping relationships among the impacts in terms of economic variables, households, government, and industry.
Research on the interconnected impacts across all these agents dominates the study, accounting for 39% of the studies. Among these, the most employed methodology is computable general equilibrium, which explicitly models the entire economy, analyses the behaviour of all economic agents simultaneously, and assesses economy-wide impacts. Additionally, the impacts on economic variables and households constitute 13% of the studies, indicating that households are particularly vulnerable and a primary concern for policymakers considering the implementation of subsidy removal. Following this, there are studies that explore the impacts on economic variables and the industrial sectors.
Positive/negative Assessment of the Price Subsidy Removal Policy
In these articles, most authors provide an overall assessment of the impacts resulting from their study, aligning with their objectives. Among the 118 selected articles, 19 do not offer an overall conclusion for the impacts. These articles examined various variables from different perspectives, particularly those focusing on the economy-wide effects of subsidy removal using the methodology of CGE (Solaymani & Kari, 2014). The impacts on different indicators vary in magnitude and sign (negative or positive), making it challenging to calculate the total net impacts. Some studies suggest that the overall impacts can be mixed (Dennis, 2016) or varied when considering other factors or examining different countries and cases (Narayanan G. & Rungta, 2014), or when accounting for stock effects (Da-Rocha et al., 2017).
Table 8 outlines the overall assessment of the impacts of price subsidy removal. Among the 118 selected articles, 64 (54%) of them empirically demonstrate overall negative impacts, such as a reduction in household welfare (Anand et al., 2014), an increase in production costs (Salimian et al., 2012), and an elevation of poverty (Solaymani et al., 2019). On the other hand, 32 articles (27%) lean towards a positive perspective, indicating that subsidy removal can be beneficial in achieving specific aims, such as reducing energy consumption (Aryanpur et al., 2022), improving environmental quality (Ovisy & Mehry, 2014), or easing traffic congestion (Burke et al., 2017). Therefore, most of the overall assessments lean towards a negative perspective on the impact of subsidy removal.
Policy Suggestion Distributions
For studies demonstrating positive impacts of price subsidy removal, the removal is considered feasible and proposed for implementation (Wang & Lin, 2017). Meanwhile, studies identifying negative impacts emphasize mitigating the adverse effects of subsidy removal (Al-Khaza’leh, 2020) to gain public support. Table 9 provides a comprehensive overview of mitigation measures derived from the review of selected articles on the removal of price subsidies. These measures aim to alleviate adverse effects on households and industrial sectors, overcoming resistance to subsidy removal. The proposed mitigation measures include targeted cash transfer, non-targeted cash transfer, industrial compensation, partial removal, gradual removal, and tax cuts. The distribution of these measures is as follows: 22 for targeted cash transfer, 21 for industrial compensation, 12 for partial removal, 7 for non-targeted cash transfer, 5 for gradual removal, and 2 for tax cuts.
Scholars have particularly focused on household mitigation measures to safeguard vulnerable households and maintain the average household’s utility at the initial level. Compensation measures for households primarily involve redistributing savings from subsidy removal through cash transfers, including targeted and non-targeted approaches. Some studies propose partial or gradual subsidy removal, suggesting that compared to fast and complete reforms, a phased approach can mitigate negative impacts on household welfare and protect low-income households (Aryanpur et al., 2022; Breisinger et al., 2019; Karami et al., 2012). Reallocation of increased revenue from subsidy removal to industries or other sectors is suggested to enhance productivity and employment (Lin & Jiang, 2011; Ying & Harun, 2019). Lower tax rates could reduce production costs, resulting in lower commodity prices and household consumption expenditure, thereby offsetting negative impacts (Lofgren & El-Said, 2001)
CONCLUSION
Based on the comprehensive review presented above, the removal of price subsidies generally results in increased prices, leading to higher production costs and household expenditures. This reform may have adverse effects on various aspects, including industrial competitiveness, output, exports, household income, and welfare. Short-term GDP decline and an increase in the poverty level are also anticipated. However, consensus on the impacts of price subsidy removal across different studies is lacking, with variations depending on cases and the extent of price subsidy reduction.
Governments are advised to assess the specific impacts of subsidy reform based on their unique situations, incorporating sector-specific disaggregation into their modelling frameworks to design effective and integrated subsidy removal schemes. Despite the empirical impact analysis, a comprehensive examination of the feasibility of price subsidy removal should also consider external factors such as public acceptance, potential unrest, and political considerations in gaining support. To ensure success without public resistance or political unrest, subsidy removal requires a carefully designed and sequenced strategy with a range of mitigation measures.
Furthermore, the existing literature predominantly focuses on the impacts of price subsidy removal on energy, neglecting sectors such as agriculture, food, and SMEs. A more comprehensive examination of the broader socio-economic landscape is needed. Enriching the literature with studies on the impacts of subsidy removal from various products beyond energy is essential for a more thorough understanding of the consequences of subsidy reforms. Future studies should address this gap by exploring the less-explored impacts of subsidy removal on diverse sectors.
The literature review’s emphasis on developing nations, especially in Asia, may neglect unique challenges and impacts in developed countries. Therefore, a more balanced exploration, taking into account both developing and developed nations, is proposed. For future research, it is recommended to investigate the impact of price subsidy removal on agricultural products, SMEs, etc., in cases from other less-studied Asian countries, developed countries, and regions. Enriching such studies is crucial to providing a comprehensive global understanding of subsidy removal impacts and enhancing the applicability of findings on a global scale.
For example, in energy subsidies, the cost of transferring one dollar to the poorest 20% group targeted through gasoline and kerosene subsidies has resulted in government expenditures of around USD$ 33 and USD$ 5, respectively (Arze del Granado et al., 2012). On average, expenditure on education and health is reduced by 0.6% of GDP if energy subsidy expenditure increases by 1% of GDP (Ebeke et al., 2015).